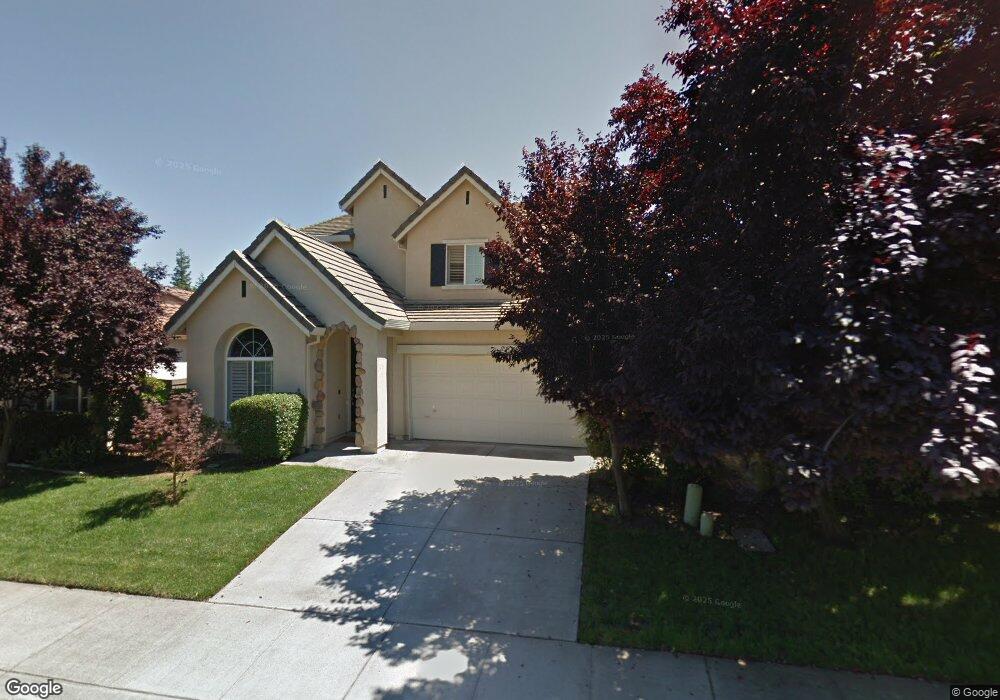
1836 Ivycrest Way Sacramento, CA 95835
Natomas Park NeighborhoodEstimated Value: $490,000 - $618,000
3
Beds
3
Baths
1,967
Sq Ft
$294/Sq Ft
Est. Value
About This Home
This home is located at 1836 Ivycrest Way, Sacramento, CA 95835 and is currently estimated at $578,424, approximately $294 per square foot. 1836 Ivycrest Way is a home located in Sacramento County with nearby schools including Natomas Park Elementary School, Natomas Middle School, and Inderkum High School.
Ownership History
Date
Name
Owned For
Owner Type
Purchase Details
Closed on
Sep 21, 2004
Sold by
Cornelison Dean S
Bought by
Yoon Chang Hoon and Lee Hyoun Jung
Current Estimated Value
Home Financials for this Owner
Home Financials are based on the most recent Mortgage that was taken out on this home.
Original Mortgage
$328,000
Outstanding Balance
$148,692
Interest Rate
4.62%
Mortgage Type
Purchase Money Mortgage
Estimated Equity
$429,732
Purchase Details
Closed on
Oct 1, 2001
Sold by
Melgoza Monet J and Melgoza Monet J
Bought by
Cornelison Dean S
Home Financials for this Owner
Home Financials are based on the most recent Mortgage that was taken out on this home.
Original Mortgage
$204,000
Interest Rate
6.9%
Purchase Details
Closed on
Aug 14, 2000
Sold by
Wl Homes Llc
Bought by
Cornelison Dean S and Melgoza Monet J
Home Financials for this Owner
Home Financials are based on the most recent Mortgage that was taken out on this home.
Original Mortgage
$166,155
Interest Rate
8.19%
Create a Home Valuation Report for This Property
The Home Valuation Report is an in-depth analysis detailing your home's value as well as a comparison with similar homes in the area
Home Values in the Area
Average Home Value in this Area
Purchase History
| Date | Buyer | Sale Price | Title Company |
|---|---|---|---|
| Yoon Chang Hoon | $411,000 | Commerce Title Company | |
| Cornelison Dean S | -- | Chicago Title Co | |
| Cornelison Dean S | $208,000 | First American Title Ins Co |
Source: Public Records
Mortgage History
| Date | Status | Borrower | Loan Amount |
|---|---|---|---|
| Open | Yoon Chang Hoon | $328,000 | |
| Previous Owner | Cornelison Dean S | $204,000 | |
| Previous Owner | Cornelison Dean S | $166,155 | |
| Closed | Cornelison Dean S | $31,154 |
Source: Public Records
Tax History Compared to Growth
Tax History
| Year | Tax Paid | Tax Assessment Tax Assessment Total Assessment is a certain percentage of the fair market value that is determined by local assessors to be the total taxable value of land and additions on the property. | Land | Improvement |
|---|---|---|---|---|
| 2025 | $7,849 | $572,882 | $118,474 | $454,408 |
| 2024 | $7,849 | $561,650 | $116,151 | $445,499 |
| 2023 | $7,485 | $550,638 | $113,874 | $436,764 |
| 2022 | $7,372 | $539,842 | $111,642 | $428,200 |
| 2021 | $6,799 | $480,431 | $153,737 | $326,694 |
| 2020 | $6,085 | $417,767 | $133,685 | $284,082 |
| 2019 | $5,900 | $401,700 | $128,544 | $273,156 |
| 2018 | $5,763 | $390,000 | $124,800 | $265,200 |
| 2017 | $6,181 | $440,521 | $122,366 | $318,155 |
| 2016 | $5,881 | $407,890 | $113,302 | $294,588 |
| 2015 | $5,557 | $388,467 | $107,907 | $280,560 |
| 2014 | $5,141 | $369,969 | $102,769 | $267,200 |
Source: Public Records
Map
Nearby Homes
- 1871 Ivycrest Way
- 371 Aviator Cir
- 4579 Juneberry Dr
- 80 Pinnacles Cir
- 1817 Terracina Dr
- 2009 N Bend Dr
- 1840 Montara Ave
- 1643 Pagoda Ln
- 1760 Montara Ave
- 4488 Juneberry Dr
- 1636 N Breezy Meadow Dr
- 1618 Aleppo Ln
- 4397 Silver Cedar Ln
- 1612 Aleppo Ln
- 1801 Baines Ave
- 4860 Blackrock Dr
- 1701 Baines Ave
- 1649 Fern Glen Ave
- 1469 Mayfield St
- 2136 Blackridge Ave
- 1830 Ivycrest Way
- 1842 Ivycrest Way
- 1824 Ivycrest Way
- 1848 Ivycrest Way
- 1818 Ivycrest Way
- 1854 Ivycrest Way
- 1837 Ivycrest Way
- 1843 Ivycrest Way
- 1831 Ivycrest Way
- 1849 Ivycrest Way
- 1825 Ivycrest Way
- 1860 Ivycrest Way
- 1812 Ivycrest Way
- 1853 Ivycrest Way
- 1817 Ivycrest Way
- 1866 Ivycrest Way
- 1859 Ivycrest Way
- 1840 Itasca Ave
- 1846 Itasca Ave
- 1834 Itasca Ave