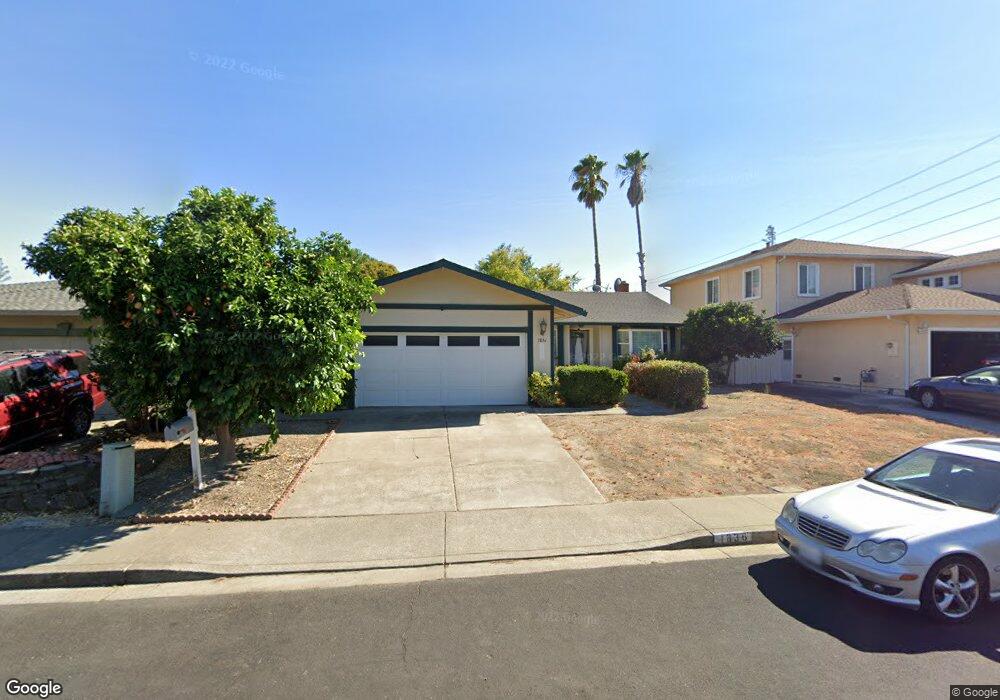
1836 Ophir Ct Martinez, CA 94553
Hidden Valley NeighborhoodEstimated Value: $743,000 - $857,000
4
Beds
2
Baths
1,517
Sq Ft
$527/Sq Ft
Est. Value
About This Home
This home is located at 1836 Ophir Ct, Martinez, CA 94553 and is currently estimated at $799,029, approximately $526 per square foot. 1836 Ophir Ct is a home located in Contra Costa County with nearby schools including Hidden Valley Elementary School, Valley View Middle School, and College Park High School.
Ownership History
Date
Name
Owned For
Owner Type
Purchase Details
Closed on
Mar 5, 2004
Sold by
Chai Pil Lim
Bought by
Chai Pil Lim and Chai James S
Current Estimated Value
Home Financials for this Owner
Home Financials are based on the most recent Mortgage that was taken out on this home.
Original Mortgage
$143,000
Interest Rate
5.69%
Mortgage Type
Purchase Money Mortgage
Create a Home Valuation Report for This Property
The Home Valuation Report is an in-depth analysis detailing your home's value as well as a comparison with similar homes in the area
Home Values in the Area
Average Home Value in this Area
Purchase History
| Date | Buyer | Sale Price | Title Company |
|---|---|---|---|
| Chai Pil Lim | $71,500 | Commonwealth Land Title | |
| Chai Pil Lim | -- | Commonwealth Land Title Co |
Source: Public Records
Mortgage History
| Date | Status | Borrower | Loan Amount |
|---|---|---|---|
| Closed | Chai Pil Lim | $143,000 |
Source: Public Records
Tax History
| Year | Tax Paid | Tax Assessment Tax Assessment Total Assessment is a certain percentage of the fair market value that is determined by local assessors to be the total taxable value of land and additions on the property. | Land | Improvement |
|---|---|---|---|---|
| 2025 | $4,263 | $294,690 | $156,015 | $138,675 |
| 2024 | $4,085 | $288,912 | $152,956 | $135,956 |
| 2023 | $4,085 | $283,248 | $149,957 | $133,291 |
| 2022 | $4,051 | $277,695 | $147,017 | $130,678 |
| 2021 | $3,899 | $272,251 | $144,135 | $128,116 |
| 2019 | $3,767 | $264,178 | $139,861 | $124,317 |
| 2018 | $3,672 | $258,999 | $137,119 | $121,880 |
| 2017 | $3,547 | $253,922 | $134,431 | $119,491 |
| 2016 | $3,449 | $248,945 | $131,796 | $117,149 |
| 2015 | $3,406 | $245,207 | $129,817 | $115,390 |
| 2014 | $3,346 | $240,405 | $127,275 | $113,130 |
Source: Public Records
Map
Nearby Homes
- 2054 Deerwood Dr
- 1602 Endriss Dr
- 116 Woodview Ct
- 1417 Rolling Hill Way
- 269 Hidden Creek Ct
- 235 Pebblecreek Ct
- 1566 Ashwood Dr
- 1487 Ashwood Dr
- 168 High St
- 319 Oak Glen Ct
- 1524 Ridgewood Dr
- 126 Saint Joan Ln
- 1444 Ashwood Dr
- 1021 Morello Ave
- 506 Midway Ct
- 1241 Raymond Dr
- 207 Midway Dr
- 1126 Maywood Ln Unit 50B
- 1080 Maywood Ln
- 3 Saint Louis Ln
Your Personal Tour Guide
Ask me questions while you tour the home.