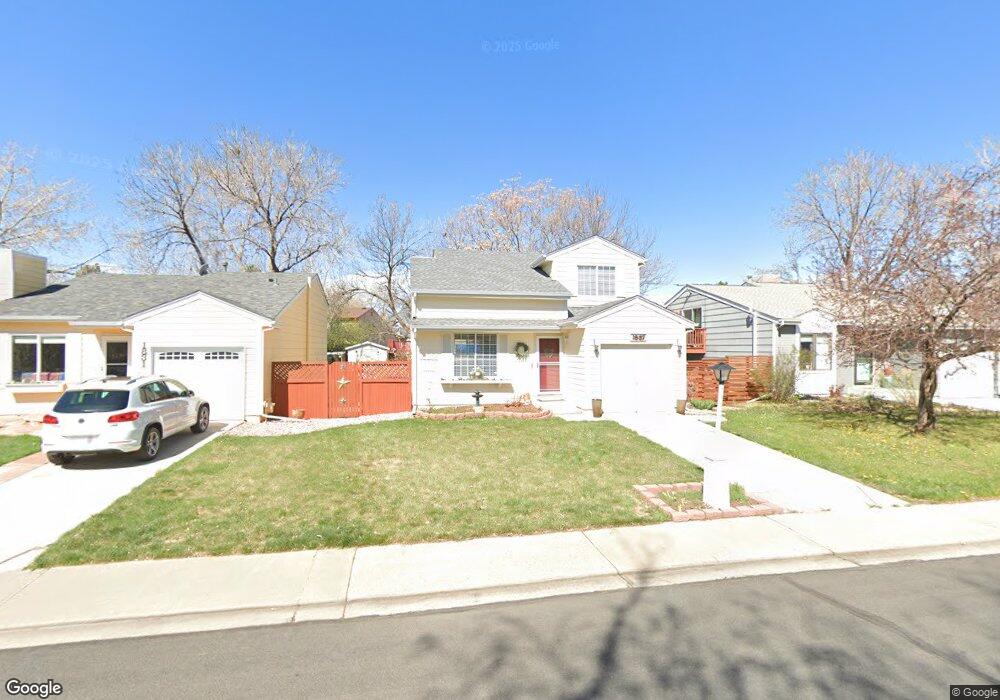
1837 Sumner St Longmont, CO 80501
Garden Acres NeighborhoodEstimated Value: $395,331 - $421,000
2
Beds
2
Baths
882
Sq Ft
$467/Sq Ft
Est. Value
About This Home
This home is located at 1837 Sumner St, Longmont, CO 80501 and is currently estimated at $411,583, approximately $466 per square foot. 1837 Sumner St is a home located in Boulder County with nearby schools including Northridge Elementary School, Longs Peak Middle School, and Longmont High School.
Ownership History
Date
Name
Owned For
Owner Type
Purchase Details
Closed on
May 19, 2010
Sold by
Quebec Re Llc
Bought by
Einspahr Amber
Current Estimated Value
Home Financials for this Owner
Home Financials are based on the most recent Mortgage that was taken out on this home.
Original Mortgage
$154,156
Outstanding Balance
$102,409
Interest Rate
4.87%
Mortgage Type
FHA
Estimated Equity
$309,174
Purchase Details
Closed on
Mar 4, 2010
Sold by
Vogel Jeffrey S and Hsbc Mortgage Services Inc
Bought by
Quebec Re Llc
Purchase Details
Closed on
Jun 16, 2006
Sold by
Reo Management 2004
Bought by
Vogel Jeffrey S
Home Financials for this Owner
Home Financials are based on the most recent Mortgage that was taken out on this home.
Original Mortgage
$156,300
Interest Rate
9.02%
Mortgage Type
Purchase Money Mortgage
Purchase Details
Closed on
Jan 10, 2006
Sold by
Menendez Carlos Alberto
Bought by
Reo Management 2004 Inc
Purchase Details
Closed on
Nov 18, 2003
Sold by
Cendant Mobility Services Corp
Bought by
Menendez Carlos Alberto
Home Financials for this Owner
Home Financials are based on the most recent Mortgage that was taken out on this home.
Original Mortgage
$180,172
Interest Rate
6.01%
Mortgage Type
FHA
Purchase Details
Closed on
May 23, 2001
Sold by
Campbell Gregory J
Bought by
Penland Laura
Home Financials for this Owner
Home Financials are based on the most recent Mortgage that was taken out on this home.
Original Mortgage
$153,745
Interest Rate
7.01%
Purchase Details
Closed on
Jan 26, 2000
Sold by
Campbell Gregory J and Campbell Margaret M
Bought by
Campbell Gregory J
Home Financials for this Owner
Home Financials are based on the most recent Mortgage that was taken out on this home.
Original Mortgage
$15,300
Interest Rate
7.95%
Mortgage Type
Stand Alone Second
Purchase Details
Closed on
Jul 21, 1997
Sold by
Boyd Lisa M
Bought by
Campbell Gregory J
Home Financials for this Owner
Home Financials are based on the most recent Mortgage that was taken out on this home.
Original Mortgage
$108,743
Interest Rate
7.72%
Mortgage Type
FHA
Purchase Details
Closed on
Aug 30, 1995
Sold by
Gallant Karl D
Bought by
Boyd Lisa M
Purchase Details
Closed on
May 23, 1994
Sold by
Gonzales Lisa M Boyd
Bought by
Boyd Lisa M
Home Financials for this Owner
Home Financials are based on the most recent Mortgage that was taken out on this home.
Original Mortgage
$67,809
Interest Rate
8.19%
Mortgage Type
FHA
Create a Home Valuation Report for This Property
The Home Valuation Report is an in-depth analysis detailing your home's value as well as a comparison with similar homes in the area
Home Values in the Area
Average Home Value in this Area
Purchase History
| Date | Buyer | Sale Price | Title Company |
|---|---|---|---|
| Einspahr Amber | $157,000 | None Available | |
| Quebec Re Llc | -- | None Available | |
| Vogel Jeffrey S | $164,500 | Land Title Guarantee Company | |
| Reo Management 2004 Inc | -- | None Available | |
| Menendez Carlos Alberto | $183,000 | Guardian Title | |
| Cendant Mobility Services Corp | $183,000 | Guardian Title | |
| Penland Laura | $158,500 | Land Title | |
| Campbell Gregory J | -- | -- | |
| Campbell Gregory J | $109,900 | -- | |
| Boyd Lisa M | -- | -- | |
| Boyd Lisa M | -- | -- | |
| Boyd Lisa M | -- | -- |
Source: Public Records
Mortgage History
| Date | Status | Borrower | Loan Amount |
|---|---|---|---|
| Open | Einspahr Amber | $154,156 | |
| Previous Owner | Vogel Jeffrey S | $156,300 | |
| Previous Owner | Menendez Carlos Alberto | $180,172 | |
| Previous Owner | Penland Laura | $153,745 | |
| Previous Owner | Campbell Gregory J | $15,300 | |
| Previous Owner | Campbell Gregory J | $108,743 | |
| Previous Owner | Boyd Lisa M | $67,809 |
Source: Public Records
Tax History
| Year | Tax Paid | Tax Assessment Tax Assessment Total Assessment is a certain percentage of the fair market value that is determined by local assessors to be the total taxable value of land and additions on the property. | Land | Improvement |
|---|---|---|---|---|
| 2025 | $1,802 | $23,544 | $4,238 | $19,306 |
| 2024 | $1,802 | $23,544 | $4,238 | $19,306 |
| 2023 | $1,778 | $18,840 | $4,757 | $17,768 |
| 2022 | $1,688 | $17,062 | $3,496 | $13,566 |
| 2021 | $1,710 | $17,553 | $3,596 | $13,957 |
| 2020 | $1,851 | $19,055 | $3,075 | $15,980 |
| 2019 | $1,822 | $19,055 | $3,075 | $15,980 |
| 2018 | $1,467 | $15,444 | $2,808 | $12,636 |
| 2017 | $1,447 | $17,074 | $3,104 | $13,970 |
| 2016 | $1,309 | $13,699 | $3,821 | $9,878 |
| 2015 | $1,248 | $11,255 | $3,582 | $7,673 |
| 2014 | $1,051 | $11,255 | $3,582 | $7,673 |
Source: Public Records
Map
Nearby Homes
- 1816 Rice St
- 1912 Rice St
- 1554 Ervine Ave
- 1640 Juniper St
- 1829 Sweeney Place
- 1729 Tulip St
- 2306 17th Ave
- 1842 Hennington Ct
- 1551 Vivian St
- 1627 Linden St
- 2034 Sumac St
- 2024 Lincoln St
- 1744 Lincoln St
- 1408 17th Ave
- 2104 18th Ave
- 2138 Daley Dr
- 0 Clyde Ct
- 2140 Sherman St
- 1851 Trevor Cir
- 2116 Addie Rose Ln
- 1831 Sumner St
- 1845 Sumner St
- 1825 Sumner St
- 1818 Rice St
- 1820 Rice St
- 1635 Ervine Ave
- 1819 Sumner St
- 1632 Feltham Place
- 1851 Sumner St
- 1814 Rice St
- 1828 Rice St
- 1631 Ervine Ave
- 1628 Feltham Place
- 1817 Sumner St
- 1855 Sumner St
- 1850 Sumner St
- 1832 Rice St
- 1627 Ervine Ave
- 1624 Feltham Place
- 1633 Feltham Place
Your Personal Tour Guide
Ask me questions while you tour the home.