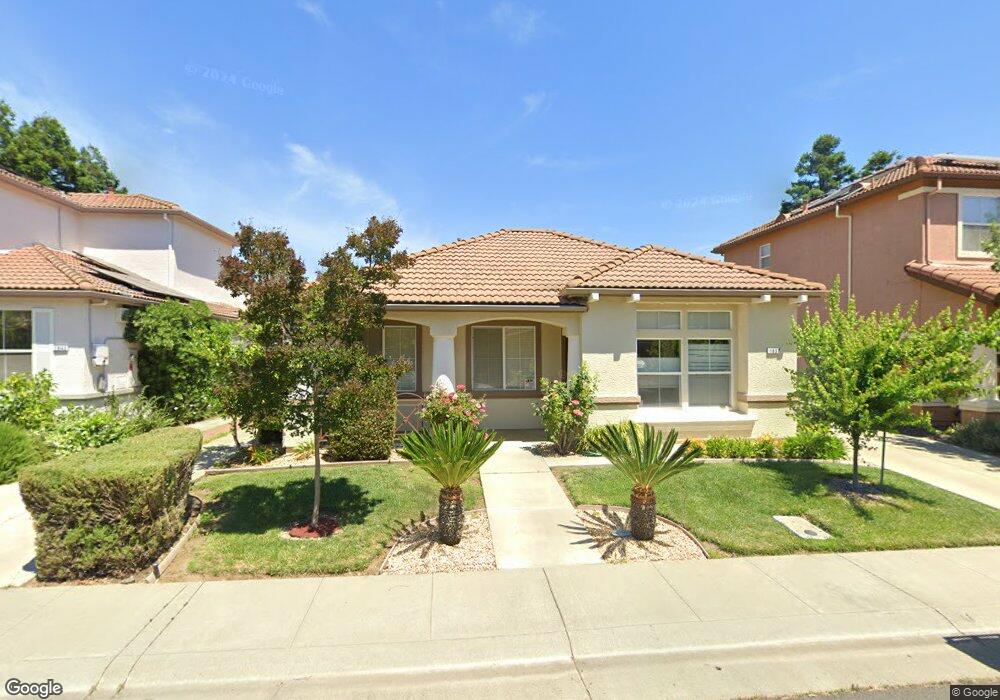
1837 Tahoe Place Davis, CA 95616
West Davis NeighborhoodEstimated Value: $745,875 - $947,000
3
Beds
2
Baths
1,498
Sq Ft
$550/Sq Ft
Est. Value
About This Home
This home is located at 1837 Tahoe Place, Davis, CA 95616 and is currently estimated at $823,969, approximately $550 per square foot. 1837 Tahoe Place is a home located in Yolo County with nearby schools including Patwin Elementary School, Ralph Waldo Emerson Junior High School, and Davis Senior High School.
Ownership History
Date
Name
Owned For
Owner Type
Purchase Details
Closed on
Jul 16, 2020
Sold by
Mansoubi Amir
Bought by
Mansoubi Amir and Mansoubi Zanyar
Current Estimated Value
Home Financials for this Owner
Home Financials are based on the most recent Mortgage that was taken out on this home.
Original Mortgage
$120,000
Outstanding Balance
$106,605
Interest Rate
3.2%
Mortgage Type
New Conventional
Estimated Equity
$717,364
Purchase Details
Closed on
Aug 21, 1998
Sold by
Stanley M Davis Co
Bought by
Mansoubi Amir
Home Financials for this Owner
Home Financials are based on the most recent Mortgage that was taken out on this home.
Original Mortgage
$134,000
Interest Rate
6.88%
Purchase Details
Closed on
Jul 10, 1998
Sold by
Rahrouh Mojgan
Bought by
Mansoubi Amir
Home Financials for this Owner
Home Financials are based on the most recent Mortgage that was taken out on this home.
Original Mortgage
$134,000
Interest Rate
6.88%
Create a Home Valuation Report for This Property
The Home Valuation Report is an in-depth analysis detailing your home's value as well as a comparison with similar homes in the area
Home Values in the Area
Average Home Value in this Area
Purchase History
| Date | Buyer | Sale Price | Title Company |
|---|---|---|---|
| Mansoubi Amir | -- | First American Title Company | |
| Mansoubi Amir | $206,500 | Placer Title | |
| Mansoubi Amir | -- | Placer Title Company |
Source: Public Records
Mortgage History
| Date | Status | Borrower | Loan Amount |
|---|---|---|---|
| Open | Mansoubi Amir | $120,000 | |
| Closed | Mansoubi Amir | $134,000 |
Source: Public Records
Tax History Compared to Growth
Tax History
| Year | Tax Paid | Tax Assessment Tax Assessment Total Assessment is a certain percentage of the fair market value that is determined by local assessors to be the total taxable value of land and additions on the property. | Land | Improvement |
|---|---|---|---|---|
| 2025 | $5,313 | $323,242 | $109,728 | $213,514 |
| 2023 | $5,313 | $310,692 | $105,468 | $205,224 |
| 2022 | $5,093 | $304,600 | $103,400 | $201,200 |
| 2021 | $4,971 | $298,628 | $101,373 | $197,255 |
| 2020 | $4,883 | $295,567 | $100,334 | $195,233 |
| 2019 | $4,608 | $289,772 | $98,367 | $191,405 |
| 2018 | $4,339 | $284,091 | $96,439 | $187,652 |
| 2017 | $4,254 | $278,522 | $94,549 | $183,973 |
| 2016 | $4,108 | $273,062 | $92,696 | $180,366 |
| 2015 | $3,986 | $268,961 | $91,304 | $177,657 |
| 2014 | $3,986 | $263,693 | $89,516 | $174,177 |
Source: Public Records
Map
Nearby Homes
- 1545 El Capitan St
- 2119 Dinosaur Place
- 1213 Arthur St
- 1211 Arthur St
- 2214 Isle Royale Ln
- 1527 Rio Grande St
- 1011 Arthur St
- 2348 Bryce Ln
- Greenway - Residence 1 Plan at Bretton Woods - Greenway
- Greenway - Residence 3 Plan at Bretton Woods - Greenway
- Greenway - Residence 2 Plan at Bretton Woods - Greenway
- Bungalows - Residence 2 Plan at Bretton Woods - Bungalows
- Bungalows - Residence 1 Plan at Bretton Woods - Bungalows
- 3303 Houser Ct
- 3407 Houser Ct
- 5542 Thomson Loop
- 5557 Thomson Loop
- 1560 Drake Dr
- 1814 Foster Ln
- 2742 Seine Ave
- 1831 Tahoe Place
- 1843 Tahoe Place
- 1838 Point Reyes Place
- 1825 Tahoe Place
- 1844 Point Reyes Place
- 1832 Point Reyes Place
- 1826 Point Reyes Place
- 1836 Tahoe Place
- 1819 Tahoe Place
- 1830 Tahoe Place
- 1419 El Capitan St
- 1425 El Capitan St
- 1824 Tahoe Place
- 1820 Point Reyes Place
- 1413 El Capitan St
- 1431 El Capitan St
- 1813 Tahoe Place
- 1407 El Capitan St
- 1818 Tahoe Place
- 1437 El Capitan St