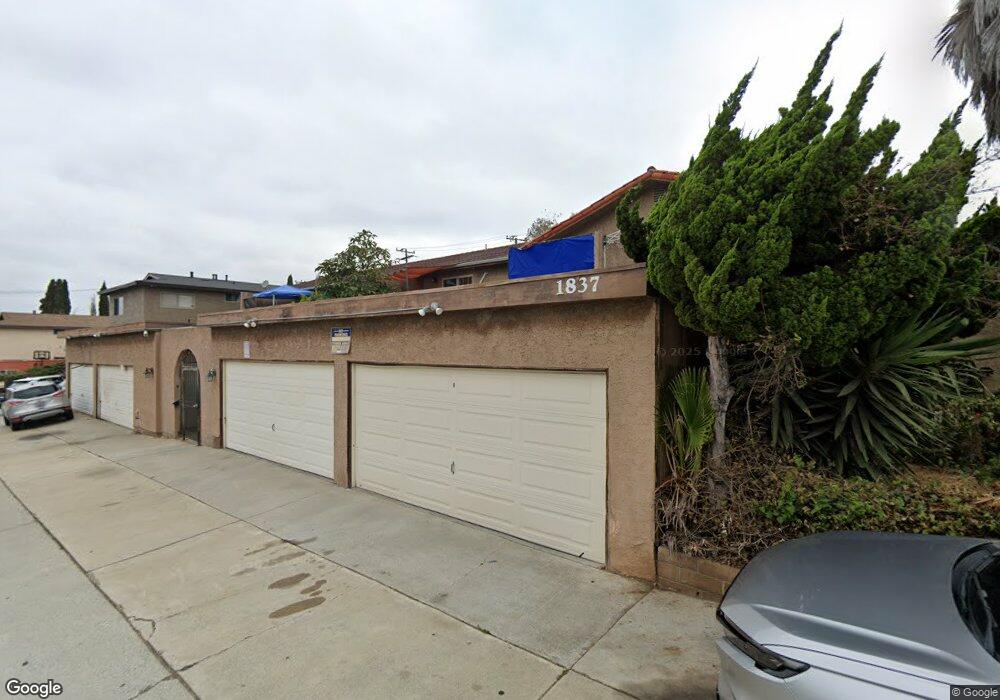
1837 Temple Ave Unit B Signal Hill, CA 90755
Estimated Value: $461,899 - $528,000
2
Beds
2
Baths
1,007
Sq Ft
$491/Sq Ft
Est. Value
About This Home
This home is located at 1837 Temple Ave Unit B, Signal Hill, CA 90755 and is currently estimated at $494,225, approximately $490 per square foot. 1837 Temple Ave Unit B is a home located in Los Angeles County with nearby schools including Alvarado Elementary, Nelson Academy, and Woodrow Wilson High School.
Ownership History
Date
Name
Owned For
Owner Type
Purchase Details
Closed on
Aug 16, 2015
Sold by
Prieto Jorge A
Bought by
Rojas Americo
Current Estimated Value
Home Financials for this Owner
Home Financials are based on the most recent Mortgage that was taken out on this home.
Original Mortgage
$152,000
Outstanding Balance
$119,303
Interest Rate
3.97%
Mortgage Type
Seller Take Back
Estimated Equity
$374,922
Purchase Details
Closed on
Jul 21, 2011
Sold by
Prieto Mark A
Bought by
Prieto Jorge
Purchase Details
Closed on
Oct 29, 2007
Sold by
Prieto Nelson H
Bought by
Prieto Mark A
Home Financials for this Owner
Home Financials are based on the most recent Mortgage that was taken out on this home.
Original Mortgage
$220,000
Interest Rate
6.35%
Mortgage Type
Purchase Money Mortgage
Purchase Details
Closed on
Aug 31, 2002
Sold by
Prieto Nelson H and Prieto Luz Nelly
Bought by
Prieto Mark A and Prieto Nelson H
Create a Home Valuation Report for This Property
The Home Valuation Report is an in-depth analysis detailing your home's value as well as a comparison with similar homes in the area
Home Values in the Area
Average Home Value in this Area
Purchase History
| Date | Buyer | Sale Price | Title Company |
|---|---|---|---|
| Rojas Americo | $160,000 | None Available | |
| Prieto Jorge | -- | None Available | |
| Prieto Mark A | -- | None Available | |
| Prieto Mark A | -- | -- |
Source: Public Records
Mortgage History
| Date | Status | Borrower | Loan Amount |
|---|---|---|---|
| Open | Rojas Americo | $152,000 | |
| Previous Owner | Prieto Mark A | $220,000 |
Source: Public Records
Tax History Compared to Growth
Tax History
| Year | Tax Paid | Tax Assessment Tax Assessment Total Assessment is a certain percentage of the fair market value that is determined by local assessors to be the total taxable value of land and additions on the property. | Land | Improvement |
|---|---|---|---|---|
| 2025 | $3,559 | $250,957 | $118,377 | $132,580 |
| 2024 | $3,559 | $246,037 | $116,056 | $129,981 |
| 2023 | $3,501 | $241,214 | $113,781 | $127,433 |
| 2022 | $3,298 | $236,485 | $111,550 | $124,935 |
| 2021 | $3,231 | $231,849 | $109,363 | $122,486 |
| 2019 | $3,187 | $224,974 | $106,120 | $118,854 |
| 2018 | $3,096 | $220,564 | $104,040 | $116,524 |
| 2016 | $2,862 | $212,000 | $100,000 | $112,000 |
| 2015 | $3,560 | $280,000 | $203,500 | $76,500 |
| 2014 | $2,250 | $161,000 | $117,000 | $44,000 |
Source: Public Records
Map
Nearby Homes
- 1837 Temple Ave Unit C
- 2720 E Wall St
- 1717 Temple Ave
- 2701 E 17th St
- 1822 Orizaba Ave
- 2722 E 20th St Unit 104
- 1994 Stanley Ave
- 1720 Junipero Ave
- 1988 Junipero Ave
- 2507 E 15th St Unit 304
- 2507 E 15th St Unit 218
- 2507 E 15th St Unit 213
- 1509 Stanley Ave Unit 203
- 1600 Junipero Ave
- 2071 Crescent Dr
- 3247 E Grant St
- 1845 Dawson Ave
- 2125 Ridgeview Terrace Dr
- 2751 E 14th St
- 1512 N Stanton Place
- 1837 Temple Ave Unit F
- 1837 Temple Ave Unit E
- 1837 Temple Ave Unit D
- 1837 Temple Ave Unit A
- 2726 E Wall St
- 1832 Temple Ave
- 1838 Temple Ave
- 2725 E Pacific Coast Hwy
- 2725 E Pacific Coast Hwy Unit 202
- 1842 Temple Ave
- 1852 Temple Ave
- 1864 Temple Ave
- 2680 E Wall St
- 2805 E Pacific Coast Hwy
- 2801 E Pacific Coast Hwy
- 1843 Gladys Ave
- 1867 Temple Ave
- 2739 E Wall St
- 1870 Temple Ave Unit A
- 1870 Temple Ave Unit D