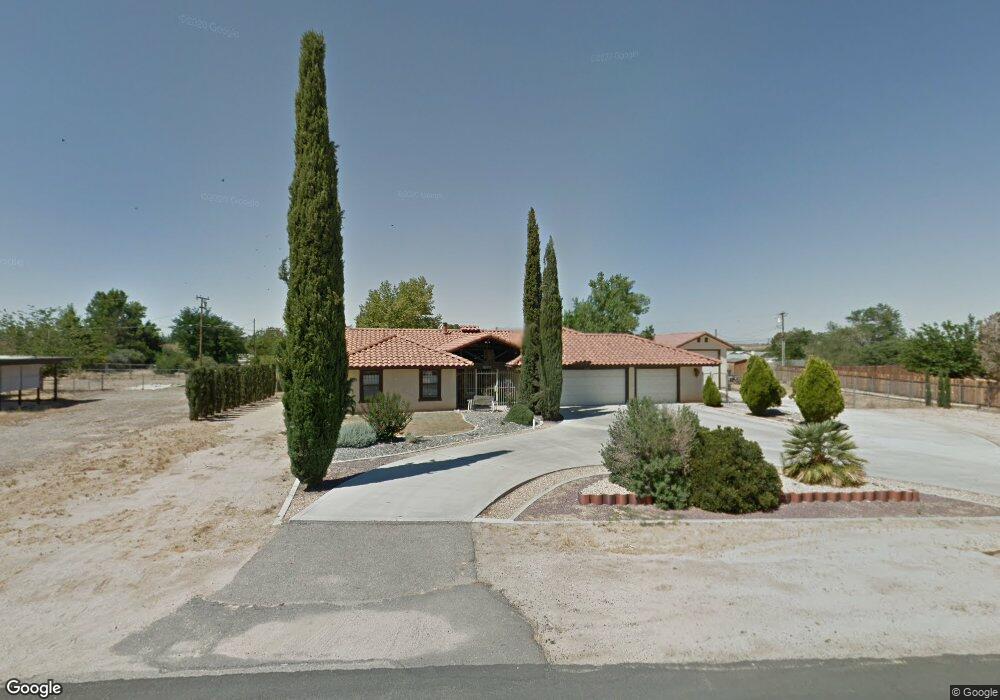
18371 Winnetka Rd Apple Valley, CA 92307
High Desert NeighborhoodEstimated Value: $508,000 - $606,000
3
Beds
2
Baths
2,336
Sq Ft
$230/Sq Ft
Est. Value
About This Home
This home is located at 18371 Winnetka Rd, Apple Valley, CA 92307 and is currently estimated at $538,082, approximately $230 per square foot. 18371 Winnetka Rd is a home located in San Bernardino County with nearby schools including Desert Knolls Elementary School, Granite Hills High School, and Academy for Academic Excellence.
Ownership History
Date
Name
Owned For
Owner Type
Purchase Details
Closed on
Aug 21, 2019
Sold by
Toole Razel Rosauro O
Bought by
Toole Michael O
Current Estimated Value
Home Financials for this Owner
Home Financials are based on the most recent Mortgage that was taken out on this home.
Original Mortgage
$309,294
Outstanding Balance
$269,758
Interest Rate
3.5%
Mortgage Type
FHA
Estimated Equity
$268,324
Purchase Details
Closed on
Jul 31, 2019
Sold by
Brown Gary R and Brown Gerri Lind
Bought by
Toole Michael O
Home Financials for this Owner
Home Financials are based on the most recent Mortgage that was taken out on this home.
Original Mortgage
$309,294
Outstanding Balance
$269,758
Interest Rate
3.5%
Mortgage Type
FHA
Estimated Equity
$268,324
Purchase Details
Closed on
Aug 3, 1996
Sold by
Brown Gary R and Brown Gerri L
Bought by
Brown Gary R and Brown Gerri Lind
Create a Home Valuation Report for This Property
The Home Valuation Report is an in-depth analysis detailing your home's value as well as a comparison with similar homes in the area
Home Values in the Area
Average Home Value in this Area
Purchase History
| Date | Buyer | Sale Price | Title Company |
|---|---|---|---|
| Toole Michael O | -- | First American Title Company | |
| Toole Michael O | $315,000 | First American Title Company | |
| Brown Gary R | -- | -- |
Source: Public Records
Mortgage History
| Date | Status | Borrower | Loan Amount |
|---|---|---|---|
| Open | Toole Michael O | $309,294 | |
| Closed | Toole Michael O | $11,025 |
Source: Public Records
Tax History Compared to Growth
Tax History
| Year | Tax Paid | Tax Assessment Tax Assessment Total Assessment is a certain percentage of the fair market value that is determined by local assessors to be the total taxable value of land and additions on the property. | Land | Improvement |
|---|---|---|---|---|
| 2025 | $3,907 | $344,500 | $68,901 | $275,599 |
| 2024 | $3,907 | $337,745 | $67,550 | $270,195 |
| 2023 | $3,872 | $331,122 | $66,225 | $264,897 |
| 2022 | $3,813 | $324,629 | $64,926 | $259,703 |
| 2021 | $3,726 | $318,264 | $63,653 | $254,611 |
| 2020 | $3,682 | $315,000 | $63,000 | $252,000 |
| 2019 | $2,562 | $224,544 | $19,886 | $204,658 |
| 2018 | $2,497 | $220,141 | $19,496 | $200,645 |
| 2017 | $2,462 | $215,825 | $19,114 | $196,711 |
| 2016 | $2,361 | $211,593 | $18,739 | $192,854 |
| 2015 | $2,325 | $208,415 | $18,458 | $189,957 |
| 2014 | $2,293 | $204,332 | $18,096 | $186,236 |
Source: Public Records
Map
Nearby Homes
- 14681 Riverside Dr
- 18255 Winnetka Rd
- 15236 Riverside Dr
- 15060 Nokomis Ct
- 14924 Chamber Ln
- 18251 Hiawatha Rd
- 0 Riverside Dr Unit HD25148269
- 15194 Tacony Rd
- 18080 Manitou Rd
- 15332 Tuscola Rd
- 18715 Mingo Rd
- 18518 Cocqui Rd
- 0 Chaparral Ln
- 14705 Mandan Rd
- 18947 Waseca Rd
- 18915 Mendota Rd
- 18539 Symeron Rd
- 14610 Havasu Rd
- 19098 Tecumseh Rd
- 14405 Mandan Rd
- 18391 Winnetka Rd
- 18312 Cocopah Rd
- 18322 Cocopah Rd
- 18326 Cocopah Rd
- 18362 Winnetka Rd
- 18302 Cocopah Rd
- 0 Winnetka Rd Unit CV13029102
- 0 Winnetka Rd Unit EV15018908
- 0 Winnetka Rd Unit 529750
- 0 Winnetka Rd Unit OC20230442
- 0 Winnetka Rd Unit 529545
- 0 Winnetka Rd Unit 328815
- 0 Winnetka Rd Unit 393239
- 0 Winnetka Rd Unit 426386
- 0 Winnetka Rd Unit 452789
- 18348 Cocopah Rd
- 18394 Winnetka Rd
- 18331 Winnetka Rd
- 0 Cocopah Rd Unit EV15150850
- 0 Cocopah Rd Unit 459744