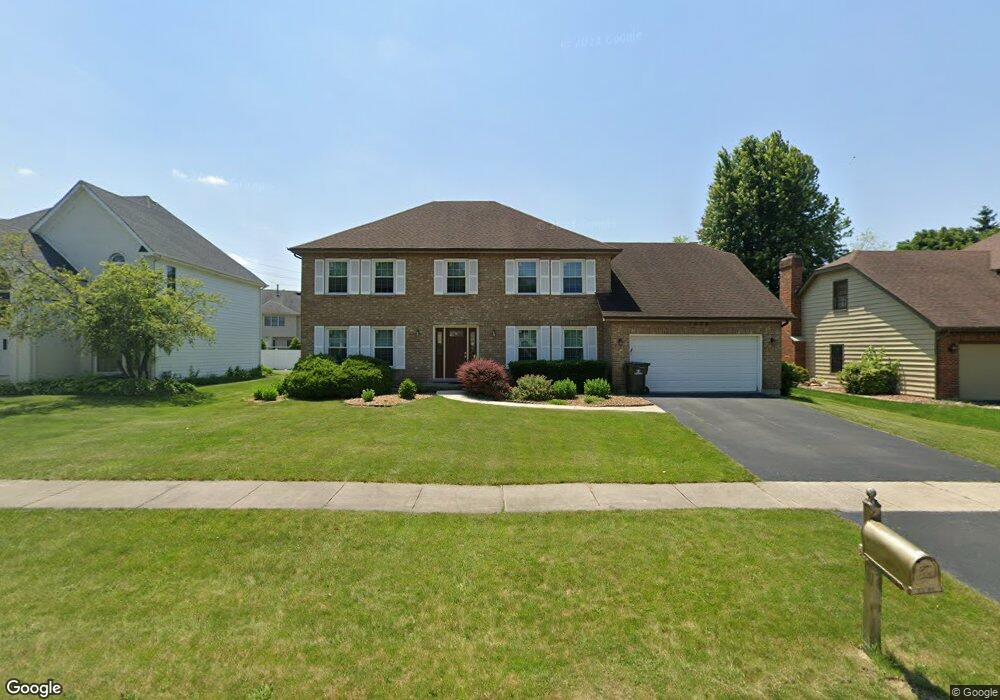
1838 Cranshire Ln Naperville, IL 60565
Greene Valley NeighborhoodEstimated Value: $672,825 - $806,000
--
Bed
1
Bath
2,960
Sq Ft
$254/Sq Ft
Est. Value
About This Home
This home is located at 1838 Cranshire Ln, Naperville, IL 60565 and is currently estimated at $751,456, approximately $253 per square foot. 1838 Cranshire Ln is a home located in DuPage County with nearby schools including Ranch View Elementary School, Kennedy Junior High School, and Naperville Central High School.
Ownership History
Date
Name
Owned For
Owner Type
Purchase Details
Closed on
Aug 13, 2024
Sold by
Singh Bhajan and Singh Balvinder K
Bought by
Declaration Of Revocable Living Trust and Singh
Current Estimated Value
Purchase Details
Closed on
Feb 4, 1999
Sold by
Chari Paresh and Chari Latha
Bought by
Singh Bhajan and Singh Balvinder K
Home Financials for this Owner
Home Financials are based on the most recent Mortgage that was taken out on this home.
Original Mortgage
$225,000
Interest Rate
6.92%
Purchase Details
Closed on
Dec 5, 1994
Sold by
Galler Bruce H and Galler Cindy A
Bought by
Chari Paresh M and Chari Latha P
Home Financials for this Owner
Home Financials are based on the most recent Mortgage that was taken out on this home.
Original Mortgage
$200,000
Interest Rate
9.06%
Create a Home Valuation Report for This Property
The Home Valuation Report is an in-depth analysis detailing your home's value as well as a comparison with similar homes in the area
Home Values in the Area
Average Home Value in this Area
Purchase History
| Date | Buyer | Sale Price | Title Company |
|---|---|---|---|
| Declaration Of Revocable Living Trust | -- | None Listed On Document | |
| Singh Bhajan | $285,000 | -- | |
| Chari Paresh M | $260,000 | Attorneys Natl Title Network |
Source: Public Records
Mortgage History
| Date | Status | Borrower | Loan Amount |
|---|---|---|---|
| Previous Owner | Singh Bhajan | $225,000 | |
| Previous Owner | Chari Paresh M | $200,000 |
Source: Public Records
Tax History Compared to Growth
Tax History
| Year | Tax Paid | Tax Assessment Tax Assessment Total Assessment is a certain percentage of the fair market value that is determined by local assessors to be the total taxable value of land and additions on the property. | Land | Improvement |
|---|---|---|---|---|
| 2024 | $10,961 | $194,925 | $68,306 | $126,619 |
| 2023 | $10,520 | $177,900 | $62,340 | $115,560 |
| 2022 | $10,253 | $169,430 | $59,370 | $110,060 |
| 2021 | $9,868 | $163,020 | $57,120 | $105,900 |
| 2020 | $9,652 | $160,090 | $56,090 | $104,000 |
| 2019 | $9,357 | $153,160 | $53,660 | $99,500 |
| 2018 | $9,360 | $153,160 | $53,660 | $99,500 |
| 2017 | $9,161 | $147,990 | $51,850 | $96,140 |
| 2016 | $8,966 | $142,640 | $49,980 | $92,660 |
| 2015 | $8,890 | $134,330 | $47,070 | $87,260 |
| 2014 | $8,703 | $127,930 | $44,830 | $83,100 |
| 2013 | $8,574 | $128,240 | $44,940 | $83,300 |
Source: Public Records
Map
Nearby Homes
- 1896 Appaloosa Dr Unit 7
- 1817 Appaloosa Dr
- 1704 Kenyon Dr
- 1519 77th St
- 1643 Estate Cir
- 1340 Auburn Ave
- 1323 Auburn Ave
- 23W731 Hobson Rd
- 23W711 Hobson Rd
- 2248 Aster Ct
- 1216 Tranquility Ct
- 707 Crestview Dr
- 816 Spindletree Ave
- 2230 Keim Rd Unit 3B
- 25 W 500 Royce Rd
- 7S610 Lynn Dr
- 621 Bourbon Ct
- 3425 83rd St Unit D5
- 1449 Whitespire Ct Unit 5104
- 3207 Foxridge Ct
- 1834 Cranshire Ln
- 1842 Cranshire Ln
- 1841 Auburn Ave
- 1837 Auburn Ave
- 1849 Auburn Ave
- 1830 Cranshire Ln
- 1839 Cranshire Ln
- 1846 Cranshire Ln
- 1835 Cranshire Ln
- 1843 Cranshire Ln
- 1833 Auburn Ave
- 1831 Cranshire Ln
- 1826 Cranshire Ln
- 1847 Cranshire Ln
- 1829 Auburn Ave
- 1827 Cranshire Ln
- 1736 Atwood Cir
- 1822 Cranshire Ln
- 1732 Atwood Cir
- 1740 Atwood Cir