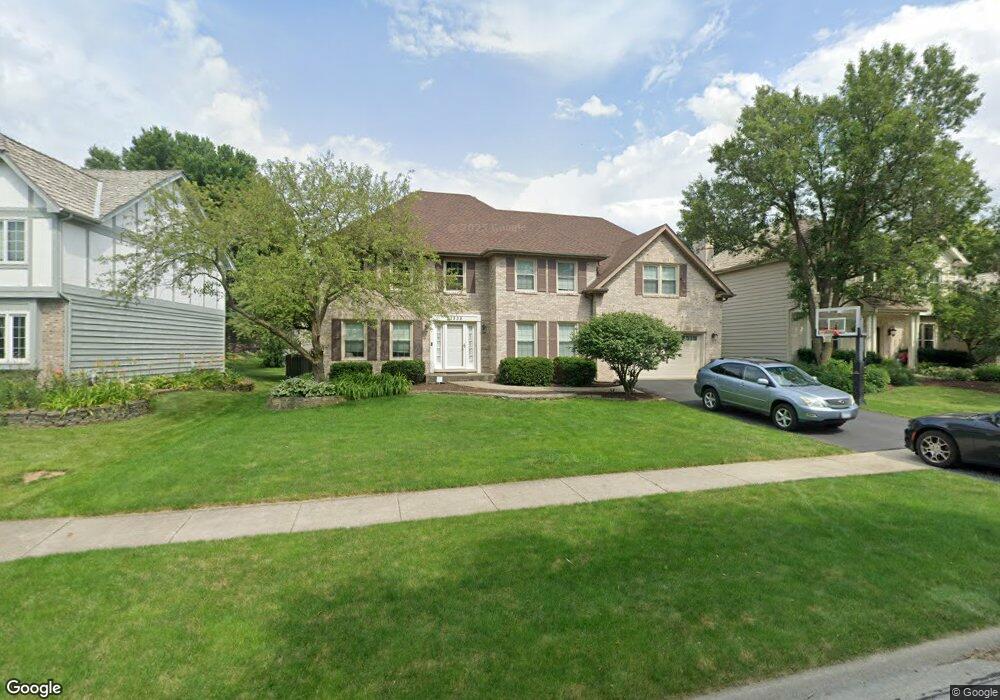
1838 River Ridge Cir Naperville, IL 60565
Meadow Glens NeighborhoodEstimated Value: $730,816 - $850,000
--
Bed
1
Bath
3,047
Sq Ft
$258/Sq Ft
Est. Value
About This Home
This home is located at 1838 River Ridge Cir, Naperville, IL 60565 and is currently estimated at $787,204, approximately $258 per square foot. 1838 River Ridge Cir is a home located in DuPage County with nearby schools including Scott Elementary School, Madison Jr High School, and Naperville Central High School.
Ownership History
Date
Name
Owned For
Owner Type
Purchase Details
Closed on
Sep 7, 2001
Sold by
Highfill Ricky E and Highfill Wendylin J
Bought by
Maniaci Joseph C and Saito Laura H
Current Estimated Value
Purchase Details
Closed on
Dec 11, 1998
Sold by
Declar Leopold Michelle K and Declar Michelle K Leopold 1997
Bought by
Highfill Ricky E and Highfill Wendylin J
Home Financials for this Owner
Home Financials are based on the most recent Mortgage that was taken out on this home.
Original Mortgage
$295,200
Interest Rate
6.83%
Purchase Details
Closed on
Aug 22, 1997
Sold by
Leopold Jeffrey R and Leopold Michelle K
Bought by
The Michelle Leopold 1997 Declaration Tr
Create a Home Valuation Report for This Property
The Home Valuation Report is an in-depth analysis detailing your home's value as well as a comparison with similar homes in the area
Home Values in the Area
Average Home Value in this Area
Purchase History
| Date | Buyer | Sale Price | Title Company |
|---|---|---|---|
| Maniaci Joseph C | $412,000 | Law Title Pick Up | |
| Highfill Ricky E | $328,000 | First American Title | |
| The Michelle Leopold 1997 Declaration Tr | -- | -- |
Source: Public Records
Mortgage History
| Date | Status | Borrower | Loan Amount |
|---|---|---|---|
| Previous Owner | Highfill Ricky E | $295,200 |
Source: Public Records
Tax History Compared to Growth
Tax History
| Year | Tax Paid | Tax Assessment Tax Assessment Total Assessment is a certain percentage of the fair market value that is determined by local assessors to be the total taxable value of land and additions on the property. | Land | Improvement |
|---|---|---|---|---|
| 2024 | $11,867 | $201,708 | $66,027 | $135,681 |
| 2023 | $11,442 | $184,090 | $60,260 | $123,830 |
| 2022 | $10,851 | $173,670 | $56,850 | $116,820 |
| 2021 | $10,457 | $167,100 | $54,700 | $112,400 |
| 2020 | $10,235 | $164,100 | $53,720 | $110,380 |
| 2019 | $9,940 | $157,010 | $51,400 | $105,610 |
| 2018 | $9,943 | $157,010 | $51,400 | $105,610 |
| 2017 | $9,745 | $151,720 | $49,670 | $102,050 |
| 2016 | $9,552 | $146,230 | $47,870 | $98,360 |
| 2015 | $9,494 | $137,710 | $45,080 | $92,630 |
| 2014 | $9,804 | $137,710 | $45,080 | $92,630 |
| 2013 | $9,656 | $138,040 | $45,190 | $92,850 |
Source: Public Records
Map
Nearby Homes
- 138 E Bailey Rd Unit M
- 1751 S Washington St Unit 1
- 158 E Bailey Rd Unit F
- 517 Sheffield Rd
- 128 E Bailey Rd Unit G
- 621 Bourbon Ct
- 302 Carriage Hill Rd
- 336 Brooklea Ct
- 1921 Wisteria Ct Unit 3
- 23 Glencoe Ct Unit 202B
- 47 Glencoe Ct Unit 102D
- 1449 Whitespire Ct Unit 5104
- 2132 Berkley Ct Unit 201A
- 805 Potomac Ave
- 1408 Swallow St
- 2280 Barth Dr
- 2279 Kaskaskia Ct
- 221 Hampshire Ct Unit 201D
- 705 Potomac Ave
- 816 Spindletree Ave
- 1832 River Ridge Cir
- 1842 River Ridge Cir
- 375 River Ridge Ct
- 1848 River Ridge Cir
- 1820 River Ridge Cir
- 379 River Ridge Ct
- 1835 River Ridge Cir
- 1839 River Ridge Cir
- 1843 River Ridge Cir
- 376 River Ridge Ct
- 1812 River Ridge Cir
- 1854 River Ridge Cir
- 1831 River Ridge Cir
- 1847 River Ridge Cir
- 1806 River Ridge Cir
- 1825 River Ridge Cir
- 383 River Ridge Ct
- 1860 River Ridge Cir
- 380 River Ridge Ct
- 1851 River Ridge Cir