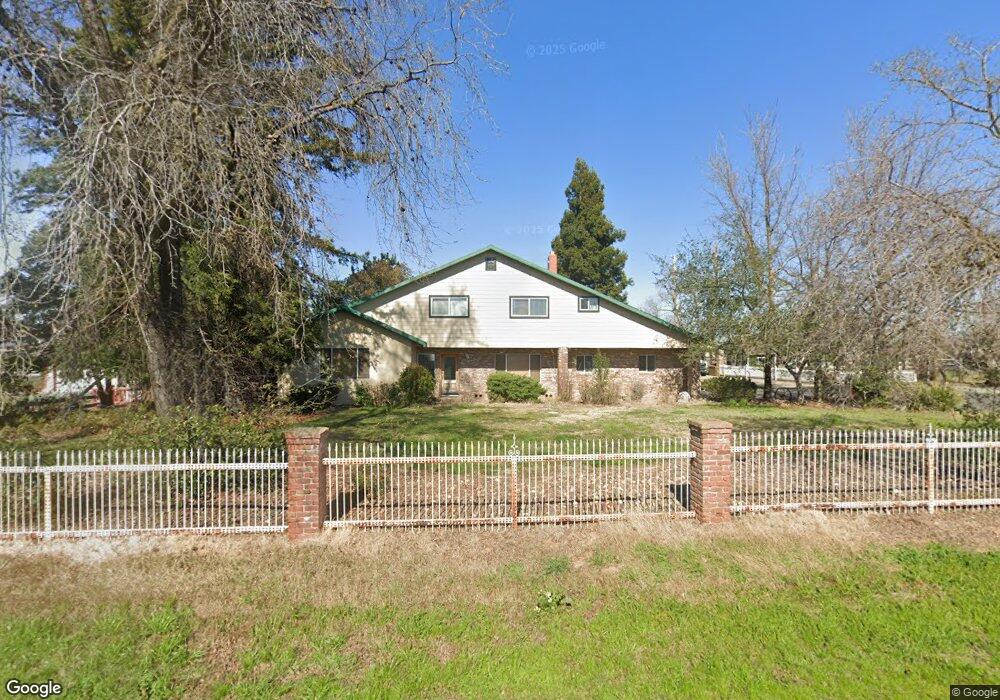
18383 E Collier Rd Acampo, CA 95220
Estimated Value: $691,000 - $731,701
3
Beds
3
Baths
2,271
Sq Ft
$316/Sq Ft
Est. Value
About This Home
This home is located at 18383 E Collier Rd, Acampo, CA 95220 and is currently estimated at $717,567, approximately $315 per square foot. 18383 E Collier Rd is a home located in San Joaquin County with nearby schools including Lockeford Elementary School and Lodi High School.
Ownership History
Date
Name
Owned For
Owner Type
Purchase Details
Closed on
Sep 17, 2019
Sold by
Ingrum David W and Ingrum Therese Raynor
Bought by
Ingrum David W and Ingrum Therese R
Current Estimated Value
Purchase Details
Closed on
Jul 27, 2018
Sold by
Ingrum David W
Bought by
Ingrum David W and Ingrum Therese Raynor
Home Financials for this Owner
Home Financials are based on the most recent Mortgage that was taken out on this home.
Original Mortgage
$329,000
Outstanding Balance
$200,833
Interest Rate
4.5%
Mortgage Type
New Conventional
Estimated Equity
$516,734
Purchase Details
Closed on
Mar 14, 2011
Sold by
Ingrum Janet
Bought by
Ingrum David
Purchase Details
Closed on
Mar 18, 2005
Sold by
Ingrum Jerry W and Ingrum Mary Lou
Bought by
Ingrum David and Ingrum Janet
Purchase Details
Closed on
Feb 29, 2000
Sold by
Ingrum Jerry W and Ingrum Mary Lou
Bought by
Ingrum Jerry W and Ingrum Mary Lou
Create a Home Valuation Report for This Property
The Home Valuation Report is an in-depth analysis detailing your home's value as well as a comparison with similar homes in the area
Home Values in the Area
Average Home Value in this Area
Purchase History
| Date | Buyer | Sale Price | Title Company |
|---|---|---|---|
| Ingrum David W | -- | None Available | |
| Ingrum David W | -- | Old Republic Title Company E | |
| Ingrum David | -- | None Available | |
| Ingrum David | -- | -- | |
| Ingrum Jerry W | -- | -- |
Source: Public Records
Mortgage History
| Date | Status | Borrower | Loan Amount |
|---|---|---|---|
| Open | Ingrum David W | $329,000 |
Source: Public Records
Tax History
| Year | Tax Paid | Tax Assessment Tax Assessment Total Assessment is a certain percentage of the fair market value that is determined by local assessors to be the total taxable value of land and additions on the property. | Land | Improvement |
|---|---|---|---|---|
| 2025 | $1,570 | $144,672 | $17,890 | $126,782 |
| 2024 | $1,528 | $141,837 | $17,540 | $124,297 |
| 2023 | $1,509 | $139,057 | $17,197 | $121,860 |
| 2022 | $1,476 | $136,331 | $16,860 | $119,471 |
| 2021 | $1,499 | $133,659 | $16,530 | $117,129 |
| 2020 | $1,462 | $132,289 | $16,361 | $115,928 |
| 2019 | $1,432 | $129,696 | $16,041 | $113,655 |
| 2018 | $1,411 | $127,154 | $15,727 | $111,427 |
| 2017 | $1,380 | $124,662 | $15,419 | $109,243 |
| 2016 | $1,296 | $122,218 | $15,117 | $107,101 |
| 2014 | $1,261 | $118,025 | $14,598 | $103,427 |
Source: Public Records
Map
Nearby Homes
- 30222 MacKville Rd
- 18529 E Hwy 88
- 22140 N Clements Rd
- 9999-lot 3 Fuhrman Rd
- 24943 N Mcintire Rd
- 24685 N Fuhrman Rd
- 22050 E Buena Vista Rd
- 25045 N Mcintire Rd
- 14267 E Peltier Rd
- 14248 E Peltier Rd
- 19901 Atkins Rd
- 14777 Liberty Rd
- 13393 E Jahant Rd
- 29266 Dry Creek Rd
- 19301 Clements Rd
- 13534 California 88
- 14431 Mira Vista Ln
- 0 E Prouty Rd
- 14255 E Prouty Rd
- 14594 E Prouty Rd
- 18293 E Collier Rd
- 18437 E Collier Rd
- 18249 E Collier Rd
- 18360 E Collier Rd
- 18599 E Collier Rd
- 18197 E Collier Rd
- 18141 E Collier Rd
- 18317 E Collier Rd
- 18083 E Collier Rd
- 18019 E Collier Rd
- 0 N MacKville Rd Unit 15065163
- 0 N MacKville Rd Unit 18033790
- 0 N MacKville Rd Unit 18082136
- 24950 N MacKville Rd
- 17903 E Collier Rd
- 24401 MacKville Rd
- 17865 E Collier Rd
- 25250 MacKville Rd
- 18025 E Collier Rd
Your Personal Tour Guide
Ask me questions while you tour the home.