Estimated Value: $458,000 - $597,000
5
Beds
2
Baths
900
Sq Ft
$558/Sq Ft
Est. Value
About This Home
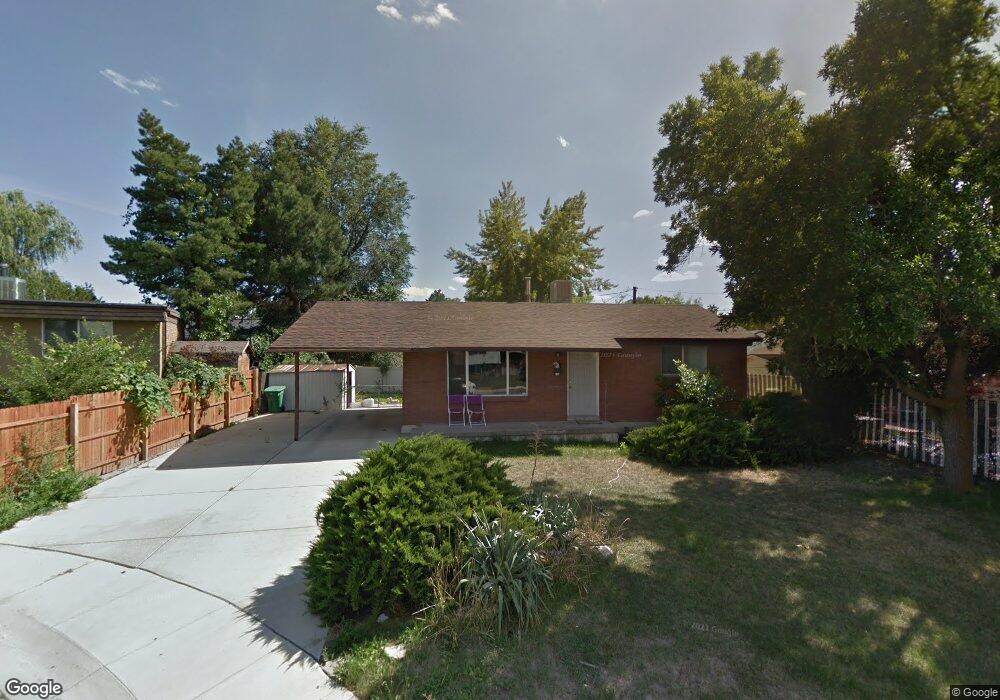
This home is located at 184 Corrie Cir, Sandy, UT 84070 and is currently estimated at $502,303, approximately $558 per square foot. 184 Corrie Cir is a home located in Salt Lake County with nearby schools including Mount Jordan Middle School, Jordan High, and Mountain Heights Academy.
Ownership History
Date
Name
Owned For
Owner Type
Purchase Details
Closed on
Nov 26, 2025
Sold by
Hartford Lester and Hartford Gloria
Bought by
Rodriguez Luis E
Current Estimated Value
Home Financials for this Owner
Home Financials are based on the most recent Mortgage that was taken out on this home.
Original Mortgage
$453,908
Outstanding Balance
$453,908
Interest Rate
6.27%
Mortgage Type
Seller Take Back
Estimated Equity
$48,395
Purchase Details
Closed on
Dec 15, 2023
Sold by
Currie Sean
Bought by
Hartford Lester and Hartford Gloria
Home Financials for this Owner
Home Financials are based on the most recent Mortgage that was taken out on this home.
Original Mortgage
$464,850
Interest Rate
7.76%
Mortgage Type
VA
Purchase Details
Closed on
Oct 11, 2017
Sold by
Cowan Jane C
Bought by
Currie Sean
Home Financials for this Owner
Home Financials are based on the most recent Mortgage that was taken out on this home.
Original Mortgage
$227,950
Interest Rate
3.78%
Mortgage Type
New Conventional
Purchase Details
Closed on
Oct 14, 1997
Sold by
Cowan Dottie
Bought by
Willoughby Dottie K and Dottie K Willoughby Marital & Family Tr
Create a Home Valuation Report for This Property
The Home Valuation Report is an in-depth analysis detailing your home's value as well as a comparison with similar homes in the area
Home Values in the Area
Average Home Value in this Area
Purchase History
| Date | Buyer | Sale Price | Title Company |
|---|---|---|---|
| Rodriguez Luis E | -- | Secure Title | |
| Hartford Lester | -- | Investors Title Insurance Agen | |
| Currie Sean | -- | First American Title | |
| Willoughby Dottie K | -- | -- |
Source: Public Records
Mortgage History
| Date | Status | Borrower | Loan Amount |
|---|---|---|---|
| Open | Rodriguez Luis E | $453,908 | |
| Previous Owner | Hartford Lester | $464,850 | |
| Previous Owner | Currie Sean | $227,950 |
Source: Public Records
Tax History
| Year | Tax Paid | Tax Assessment Tax Assessment Total Assessment is a certain percentage of the fair market value that is determined by local assessors to be the total taxable value of land and additions on the property. | Land | Improvement |
|---|---|---|---|---|
| 2025 | $2,432 | $461,300 | $176,700 | $284,600 |
| 2024 | $2,432 | $449,800 | $171,900 | $277,900 |
| 2023 | $2,015 | $371,500 | $167,200 | $204,300 |
| 2022 | $2,044 | $368,200 | $107,800 | $260,400 |
| 2021 | $1,827 | $280,100 | $82,700 | $197,400 |
| 2020 | $1,732 | $250,400 | $82,700 | $167,700 |
| 2019 | $1,657 | $233,500 | $78,000 | $155,500 |
| 2018 | $1,524 | $223,600 | $78,000 | $145,600 |
| 2017 | $1,438 | $201,500 | $78,000 | $123,500 |
| 2016 | $1,436 | $194,600 | $78,000 | $116,600 |
| 2015 | $1,432 | $179,500 | $75,700 | $103,800 |
| 2014 | $1,399 | $171,900 | $73,400 | $98,500 |
Source: Public Records
Map
Nearby Homes
- 186 Brent Cir
- 9203 S 220 E
- 37 Crawford Place
- 9822 S Darin Dr
- 8750 S 500 E
- 8812 S Cy's Park Ln Unit 6
- 8807 S Cy's Park Ln E Unit 1
- 8806 S Cy's Park Ln E Unit 4
- 8808 S Cy's Park Unit 5
- 9420 S Streatham Rd
- 165 Albion Village Way Unit 303
- 165 Albion Village Way Unit 202
- 8953 S 90 E
- 170 Albion Village Way Unit 202
- 9835 S 610 E
- 8475 S State St
- 8823 S 300 E
- 8915 S 660 E Unit 103
- 807 E Whisper Cove Rd
- 608 E 8800 S
Your Personal Tour Guide
Ask me questions while you tour the home.