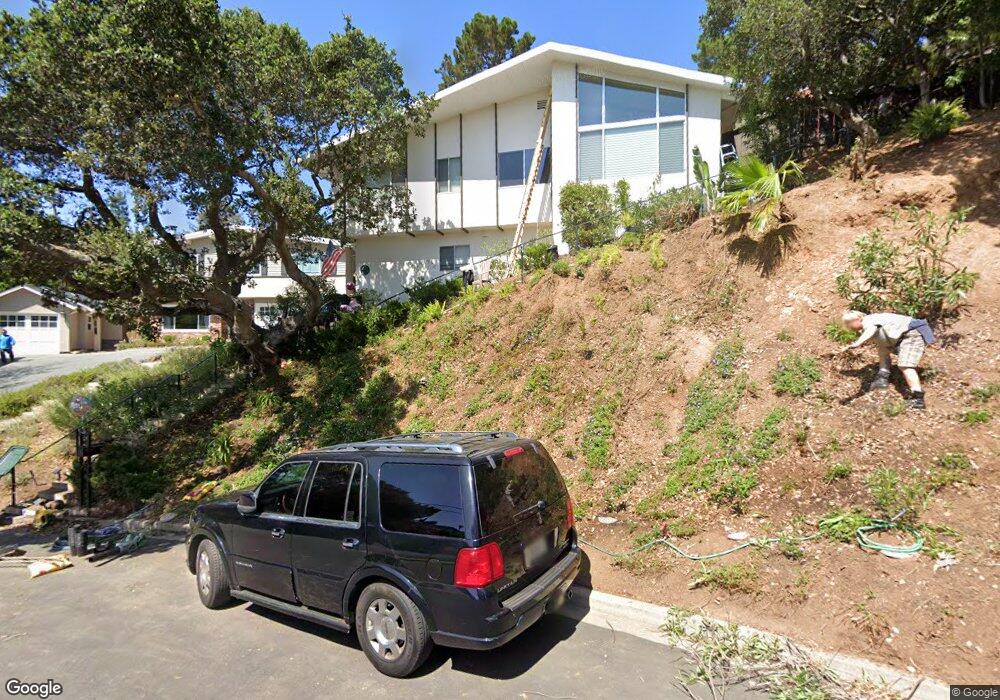
184 Dartmouth Ave San Carlos, CA 94070
Cordes NeighborhoodEstimated Value: $2,328,000 - $2,675,000
3
Beds
2
Baths
1,720
Sq Ft
$1,415/Sq Ft
Est. Value
About This Home
This home is located at 184 Dartmouth Ave, San Carlos, CA 94070 and is currently estimated at $2,433,347, approximately $1,414 per square foot. 184 Dartmouth Ave is a home located in San Mateo County with nearby schools including Arundel Elementary School, Tierra Linda Middle School, and Carlmont High School.
Ownership History
Date
Name
Owned For
Owner Type
Purchase Details
Closed on
Jan 25, 2018
Sold by
Siben Alex G and The 1995 Alex G Sieben And E Y
Bought by
Sieben Alex G and Sieben Trust
Current Estimated Value
Purchase Details
Closed on
Nov 17, 2009
Sold by
Piazza Pat and Piazza Cynthia
Bought by
Sieben Alex G and Yvonne Sieben E
Purchase Details
Closed on
Apr 15, 1998
Sold by
Sieben Alex G
Bought by
Sieben Alex G and Yvonne Sieben E
Home Financials for this Owner
Home Financials are based on the most recent Mortgage that was taken out on this home.
Original Mortgage
$200,000
Interest Rate
7.02%
Purchase Details
Closed on
Mar 5, 1998
Sold by
Sieben Alex G
Bought by
Sieben Alex G and Sieben Yvonne
Home Financials for this Owner
Home Financials are based on the most recent Mortgage that was taken out on this home.
Original Mortgage
$200,000
Interest Rate
7.02%
Purchase Details
Closed on
Nov 17, 1995
Sold by
Sieben Alex G and Sieben Yvonne
Bought by
Sieben Alex G and Yvonne Sieben E
Create a Home Valuation Report for This Property
The Home Valuation Report is an in-depth analysis detailing your home's value as well as a comparison with similar homes in the area
Home Values in the Area
Average Home Value in this Area
Purchase History
| Date | Buyer | Sale Price | Title Company |
|---|---|---|---|
| Sieben Alex G | -- | None Available | |
| Sieben Alex G | -- | None Available | |
| Sieben Alex G | -- | -- | |
| Sieben Alex G | -- | First American Title Co | |
| Sieben Alex G | -- | -- |
Source: Public Records
Mortgage History
| Date | Status | Borrower | Loan Amount |
|---|---|---|---|
| Previous Owner | Sieben Alex G | $200,000 |
Source: Public Records
Tax History Compared to Growth
Tax History
| Year | Tax Paid | Tax Assessment Tax Assessment Total Assessment is a certain percentage of the fair market value that is determined by local assessors to be the total taxable value of land and additions on the property. | Land | Improvement |
|---|---|---|---|---|
| 2025 | $3,595 | $159,081 | $29,398 | $129,683 |
| 2023 | $3,595 | $152,906 | $28,257 | $124,649 |
| 2022 | $3,440 | $149,908 | $27,703 | $122,205 |
| 2021 | $3,361 | $146,969 | $27,160 | $119,809 |
| 2020 | $3,291 | $145,463 | $26,882 | $118,581 |
| 2019 | $3,135 | $142,611 | $26,355 | $116,256 |
| 2018 | $2,963 | $139,816 | $25,839 | $113,977 |
| 2017 | $2,891 | $137,076 | $25,333 | $111,743 |
| 2016 | $2,798 | $134,389 | $24,837 | $109,552 |
| 2015 | $2,791 | $132,371 | $24,464 | $107,907 |
| 2014 | $2,608 | $129,779 | $23,985 | $105,794 |
Source: Public Records
Map
Nearby Homes
- 241 Shelford Ave
- 46 Arch Ln
- 1630 Courtland Rd
- 70 Ensenada Rd
- 1220 Chula Vista Dr
- 5 Spring Valley Way
- 7 Chestnut St
- 1308 Sunnyslope Ave
- 300 Manzanita Ave
- 171 Exeter Ave
- 21 Highland Ave
- 28 Kirkwood Way
- 90 Gateway Ct
- 38 Sequoia Ct
- 158 Manor Dr
- 212 Manor Dr
- 1315 Alameda de Las Pulgas
- 905 South Rd
- 88 Madera Ave
- 0 Devonshire Blvd
- 21 Anchor Ln
- 192 Dartmouth Ave
- 228 Shelford Ave
- 232 Shelford Ave
- 226 Shelford Ave
- 238 Shelford Ave
- 15 Anchor Ln
- 244 Shelford Ave
- 216 Shelford Ave
- 1 Pepper Ln
- 250 Shelford Ave
- 9 Anchor Ln
- 5 Pepper Ln
- 192 Shelford Ave
- 7 Anchor Ln
- 158 Northam Ave
- 219 Shelford Ave
- 9 Pepper Ln
- 920 Buckland Ave
- 910 Buckland Ave