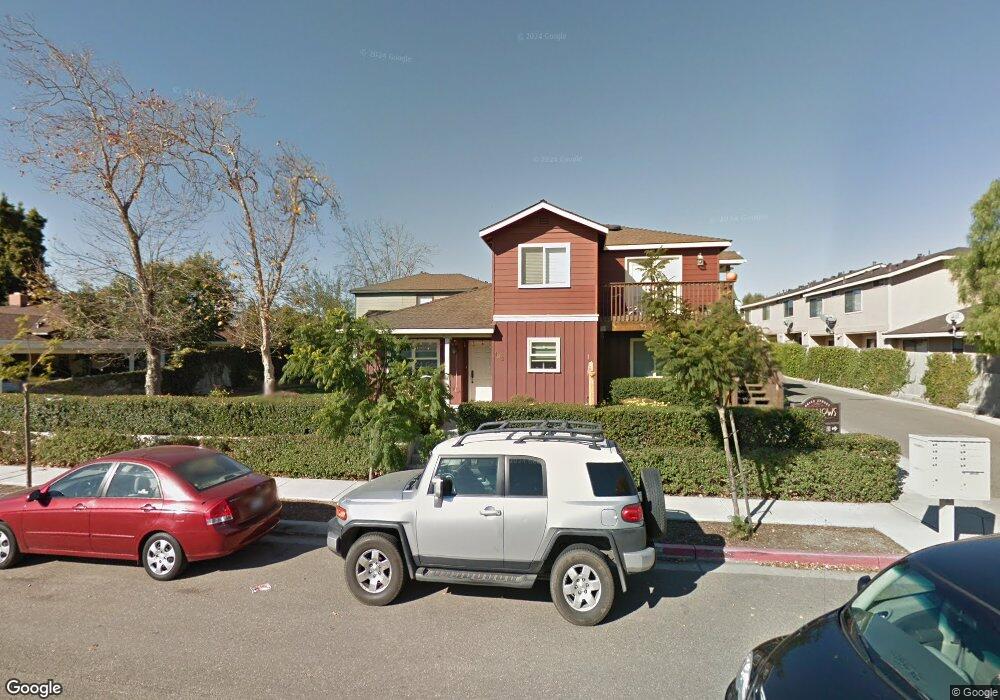
184 W Price St Nipomo, CA 93444
Estimated Value: $597,404 - $800,000
3
Beds
4
Baths
1,836
Sq Ft
$391/Sq Ft
Est. Value
About This Home
This home is located at 184 W Price St, Nipomo, CA 93444 and is currently estimated at $717,351, approximately $390 per square foot. 184 W Price St is a home located in San Luis Obispo County with nearby schools including Nipomo Elementary School, Mesa Middle School, and Nipomo High School.
Ownership History
Date
Name
Owned For
Owner Type
Purchase Details
Closed on
Jun 8, 2020
Sold by
Shwiyhat Sami
Bought by
Shwiyhat Sami and Shwiyhat Dina
Current Estimated Value
Purchase Details
Closed on
Feb 14, 2012
Sold by
Shwiyhat Chuch
Bought by
Shwiyhat Sami
Purchase Details
Closed on
Aug 24, 2011
Sold by
Shwiyhat Dina
Bought by
Shwiyhat Sami
Purchase Details
Closed on
Dec 20, 2010
Sold by
Martin Claire
Bought by
Federal Home Loan Mortgage Corporation
Create a Home Valuation Report for This Property
The Home Valuation Report is an in-depth analysis detailing your home's value as well as a comparison with similar homes in the area
Home Values in the Area
Average Home Value in this Area
Purchase History
| Date | Buyer | Sale Price | Title Company |
|---|---|---|---|
| Shwiyhat Sami | -- | None Available | |
| Shwiyhat Sami | -- | None Available | |
| Shwiyhat Sami | -- | Ticor Title | |
| Shwiyhat Chuck | -- | Ticor Title | |
| Shwiyhat Chuck | $259,000 | Ticor Title | |
| Federal Home Loan Mortgage Corporation | $284,365 | Ticor Title |
Source: Public Records
Tax History Compared to Growth
Tax History
| Year | Tax Paid | Tax Assessment Tax Assessment Total Assessment is a certain percentage of the fair market value that is determined by local assessors to be the total taxable value of land and additions on the property. | Land | Improvement |
|---|---|---|---|---|
| 2025 | $3,346 | $325,304 | $100,478 | $224,826 |
| 2024 | $3,308 | $318,926 | $98,508 | $220,418 |
| 2023 | $3,308 | $312,674 | $96,577 | $216,097 |
| 2022 | $3,258 | $306,544 | $94,684 | $211,860 |
| 2021 | $3,252 | $300,534 | $92,828 | $207,706 |
| 2020 | $3,215 | $297,454 | $91,877 | $205,577 |
| 2019 | $3,195 | $291,623 | $90,076 | $201,547 |
| 2018 | $3,157 | $285,906 | $88,310 | $197,596 |
| 2017 | $3,098 | $280,301 | $86,579 | $193,722 |
| 2016 | $2,922 | $274,806 | $84,882 | $189,924 |
| 2015 | $2,880 | $270,679 | $83,607 | $187,072 |
| 2014 | $2,773 | $265,378 | $81,970 | $183,408 |
Source: Public Records
Map
Nearby Homes
- 90111003 W Price St
- 0 S Burton St
- 1 W Branch St
- 189 E Tefft St
- 150 E Chestnut St
- 449 W Tefft St Unit 23
- 449 W Tefft St Unit 13
- 160 San Antonio Ln
- 285 E Tefft St
- 400 N Oakglen Ave
- 412 N Mallagh St
- 525 Grande Ave Unit D
- 368 Avenida de Amigos
- 450 Avenida de Socios Unit 12
- 424 Bermuda Place
- 626 Juno Ct
- Mesa Plan at Hill Street Terraces - Hill Street Series
- Pacific Plan at Hill Street Terraces - Hill Street Series
- Monarch Plan at Hill Street Terraces - Hill Street Series
- Rancho Plan at Hill Street Terraces - Hill Street Series