Estimated Value: $657,153 - $706,000
4
Beds
3
Baths
2,282
Sq Ft
$299/Sq Ft
Est. Value
About This Home
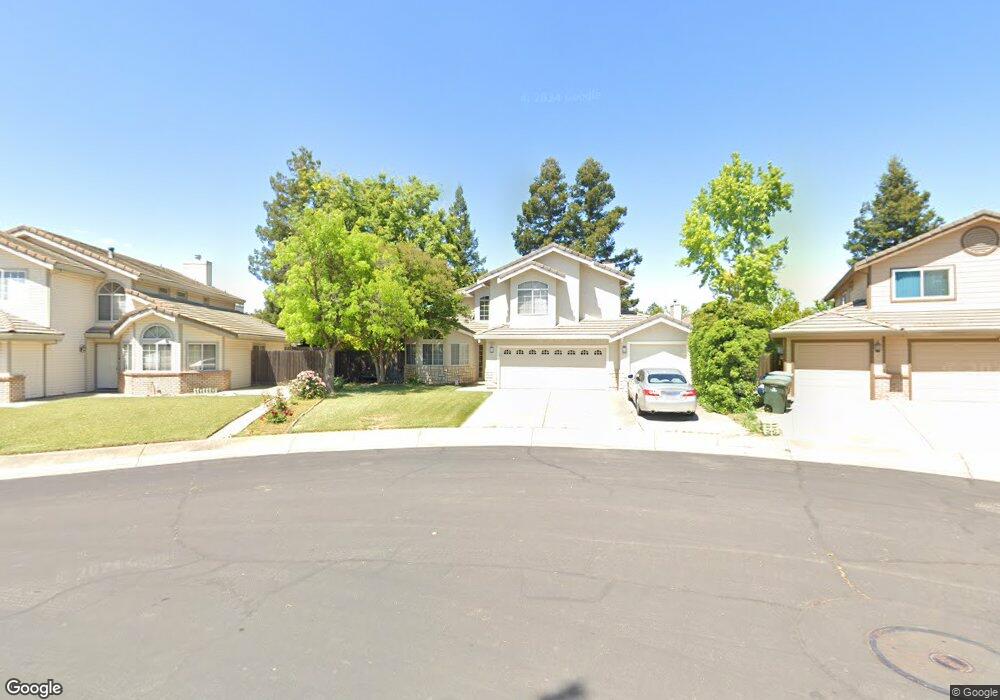
This home is located at 1840 Dailey Dr, Dixon, CA 95620 and is currently estimated at $681,538, approximately $298 per square foot. 1840 Dailey Dr is a home located in Solano County with nearby schools including Tremont Elementary School, Dixon High School, and Dixon Montessori Charter.
Ownership History
Date
Name
Owned For
Owner Type
Purchase Details
Closed on
Nov 13, 2018
Sold by
Vega Gilbert and Vega Marlene
Bought by
Vega Gilbert and Vega Marlene
Current Estimated Value
Purchase Details
Closed on
Oct 13, 2014
Sold by
Quality Investment Group Llc
Bought by
Vega Gilbert and Vega Marlene
Home Financials for this Owner
Home Financials are based on the most recent Mortgage that was taken out on this home.
Original Mortgage
$428,695
Outstanding Balance
$328,657
Interest Rate
4.1%
Mortgage Type
VA
Estimated Equity
$352,881
Purchase Details
Closed on
Jun 23, 2014
Sold by
Nunez Jose and Nunez Sandra
Bought by
Quality Investment Group Llc
Purchase Details
Closed on
Oct 15, 2002
Sold by
Nunez Genaro G and Nunez Jose
Bought by
Nunez Jose and Nunez Sandra
Home Financials for this Owner
Home Financials are based on the most recent Mortgage that was taken out on this home.
Original Mortgage
$235,000
Interest Rate
6.05%
Create a Home Valuation Report for This Property
The Home Valuation Report is an in-depth analysis detailing your home's value as well as a comparison with similar homes in the area
Home Values in the Area
Average Home Value in this Area
Purchase History
| Date | Buyer | Sale Price | Title Company |
|---|---|---|---|
| Vega Gilbert | -- | None Available | |
| Vega Gilbert | $415,000 | Fidelity National Title Co | |
| Quality Investment Group Llc | $330,100 | None Available | |
| Nunez Jose | $117,500 | First American Title Guarant |
Source: Public Records
Mortgage History
| Date | Status | Borrower | Loan Amount |
|---|---|---|---|
| Open | Vega Gilbert | $428,695 | |
| Previous Owner | Nunez Jose | $235,000 |
Source: Public Records
Tax History
| Year | Tax Paid | Tax Assessment Tax Assessment Total Assessment is a certain percentage of the fair market value that is determined by local assessors to be the total taxable value of land and additions on the property. | Land | Improvement |
|---|---|---|---|---|
| 2025 | $5,746 | $498,758 | $126,190 | $372,568 |
| 2024 | $5,746 | $488,979 | $123,716 | $365,263 |
| 2023 | $5,578 | $479,392 | $121,291 | $358,101 |
| 2022 | $5,496 | $469,993 | $118,913 | $351,080 |
| 2021 | $5,428 | $460,779 | $116,582 | $344,197 |
| 2020 | $5,342 | $456,055 | $115,387 | $340,668 |
| 2019 | $5,242 | $447,114 | $113,125 | $333,989 |
| 2018 | $5,220 | $438,348 | $110,907 | $327,441 |
| 2017 | $5,092 | $429,754 | $108,733 | $321,021 |
| 2016 | $4,877 | $421,328 | $106,601 | $314,727 |
| 2015 | $4,767 | $415,000 | $105,000 | $310,000 |
| 2014 | $3,674 | $315,320 | $88,282 | $227,038 |
Source: Public Records
Map
Nearby Homes
- 1845 Derby Dr
- 265 Ahern Ln
- 2035 Rehrmann Dr
- 690 Woodard Way
- 525 Fruit Tree Rd
- 675 Brians Way
- 1770 Butterfly Ln
- 2100 Lark Way
- 2130 Lark Way
- 1365 Jacobs Place
- 1330 Blackberry Ct
- 1315 Jacobs Place
- 445 Farmhouse Ln
- 315 White Owl St
- 465 Farmhouse Ln
- 450 Farmhouse Ln
- 1250 Redwood Ct
- 1500 Goldfield Ct
- 1530 Ferrero Dr
- 1310 Hawthorne Ct
- 1850 Dailey Dr
- 1830 Dailey Dr
- 1795 Rehrmann Dr
- 1805 Rehrmann Dr
- 1785 Rehrmann Dr
- 1860 Dailey Dr
- 1820 Dailey Dr
- 1825 Rehrmann Dr
- 1775 Rehrmann Dr
- 1865 Dailey Dr
- 215 Carpenter Ct
- 1810 Dailey Dr
- 1765 Rehrmann Dr
- 200 Carpenter Ct
- 1870 Dailey Dr
- 190 Bloom Dr
- 1865 Rehrmann Dr
- 1745 Rehrmann Dr
- 210 Carpenter Ct
Your Personal Tour Guide
Ask me questions while you tour the home.