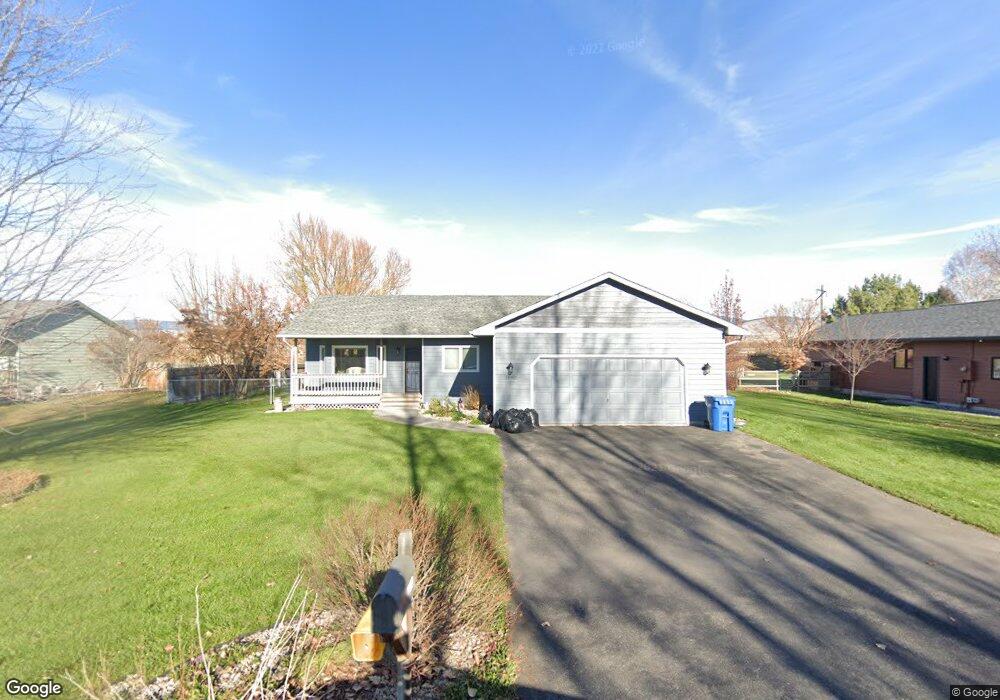
1840 Mullan Trail Missoula, MT 59808
Captain John Mullan NeighborhoodEstimated Value: $493,947 - $698,000
3
Beds
2
Baths
1,143
Sq Ft
$489/Sq Ft
Est. Value
About This Home
This home is located at 1840 Mullan Trail, Missoula, MT 59808 and is currently estimated at $559,237, approximately $489 per square foot. 1840 Mullan Trail is a home located in Missoula County with nearby schools including Hellgate Elementary Lower Grades, Hellgate Middle School, and Big Sky High School.
Ownership History
Date
Name
Owned For
Owner Type
Purchase Details
Closed on
May 1, 2023
Sold by
Sauerbier Michael T
Bought by
Sauerbier Caleb M and Sauerbier Kortney A
Current Estimated Value
Home Financials for this Owner
Home Financials are based on the most recent Mortgage that was taken out on this home.
Original Mortgage
$450,000
Outstanding Balance
$437,959
Interest Rate
6.6%
Mortgage Type
Seller Take Back
Estimated Equity
$121,278
Purchase Details
Closed on
Nov 14, 2008
Sold by
Mcguire Paul W and Mcguire Caralee
Bought by
Sauerbier Michael T
Purchase Details
Closed on
Jan 29, 2007
Sold by
Mcguire Paul W
Bought by
Mcguire Paul W and Mcguire Caralee
Home Financials for this Owner
Home Financials are based on the most recent Mortgage that was taken out on this home.
Original Mortgage
$194,750
Interest Rate
6.1%
Mortgage Type
Purchase Money Mortgage
Create a Home Valuation Report for This Property
The Home Valuation Report is an in-depth analysis detailing your home's value as well as a comparison with similar homes in the area
Home Values in the Area
Average Home Value in this Area
Purchase History
| Date | Buyer | Sale Price | Title Company |
|---|---|---|---|
| Sauerbier Caleb M | -- | Title Services | |
| Sauerbier Caleb M | -- | Title Services | |
| Sauerbier Michael T | -- | Pte | |
| Mcguire Paul W | -- | First American Title Co | |
| Mcguire Paul W | -- | First American Title Co |
Source: Public Records
Mortgage History
| Date | Status | Borrower | Loan Amount |
|---|---|---|---|
| Open | Sauerbier Caleb M | $450,000 | |
| Closed | Sauerbier Caleb M | $450,000 | |
| Previous Owner | Mcguire Paul W | $194,750 |
Source: Public Records
Tax History Compared to Growth
Tax History
| Year | Tax Paid | Tax Assessment Tax Assessment Total Assessment is a certain percentage of the fair market value that is determined by local assessors to be the total taxable value of land and additions on the property. | Land | Improvement |
|---|---|---|---|---|
| 2025 | $3,538 | $479,069 | $217,759 | $261,310 |
| 2024 | $4,040 | $364,400 | $116,791 | $247,609 |
| 2023 | $3,430 | $364,400 | $116,791 | $247,609 |
| 2022 | $3,297 | $291,400 | $118,985 | $172,415 |
| 2021 | $3,267 | $291,400 | $0 | $0 |
| 2020 | $3,087 | $269,600 | $0 | $0 |
| 2019 | $3,048 | $269,600 | $0 | $0 |
| 2018 | $2,736 | $244,365 | $0 | $0 |
| 2017 | $2,462 | $244,365 | $0 | $0 |
| 2016 | $2,416 | $233,200 | $0 | $0 |
| 2015 | $2,282 | $233,200 | $0 | $0 |
| 2014 | $2,273 | $126,193 | $0 | $0 |
Source: Public Records
Map
Nearby Homes
- 6745 Prairie Schooner Ln
- 1745 Dino Ct
- 6445 Mullan Rd
- 5911 Lariat Loop
- 5763 Horn Rd
- 5784 Horn Rd
- 1760 Dukes Ave
- 2514 Fence Line Dr
- 6125 Mullan Rd Unit Trlr 5
- 5497 Cattle Dr
- 2421 Half Hitch Dr
- 2150B Chuck Wagon Dr Unit B
- Lot 59 Nesting Ln
- Lot 60 Nesting Ln
- Lot 58 Nesting Ln
- 2181 Horsetail Ln
- Lot 87 Horsetail Ln
- 2171 Horsetail Ln
- Lot 108 Nesting Ln
- Lot 63 Nesting Ln
- 1830 Mullan Trail
- 1830 Mullan Trail
- 1850 Mullan Trail
- 1860 Mullan Trail
- 1820 Mullan Trail
- 1845 Mullan Trail
- 1825 Mullan Trail
- 1810 Mullan Trail
- 1810 Mullan Tr
- 1870 Mullan Trail
- 1895 Mullan Trail
- 1815 Mullan Trail
- 1800 Mullan Trail
- 1880 Mullan Trail
- 1805 Mullan Trail
- Lot 269 Concho Way
- 1890 Mullan Trail
- 1795 Mullan Trail
- 1790 Mullan Trail
- 1900 Mullan Trail