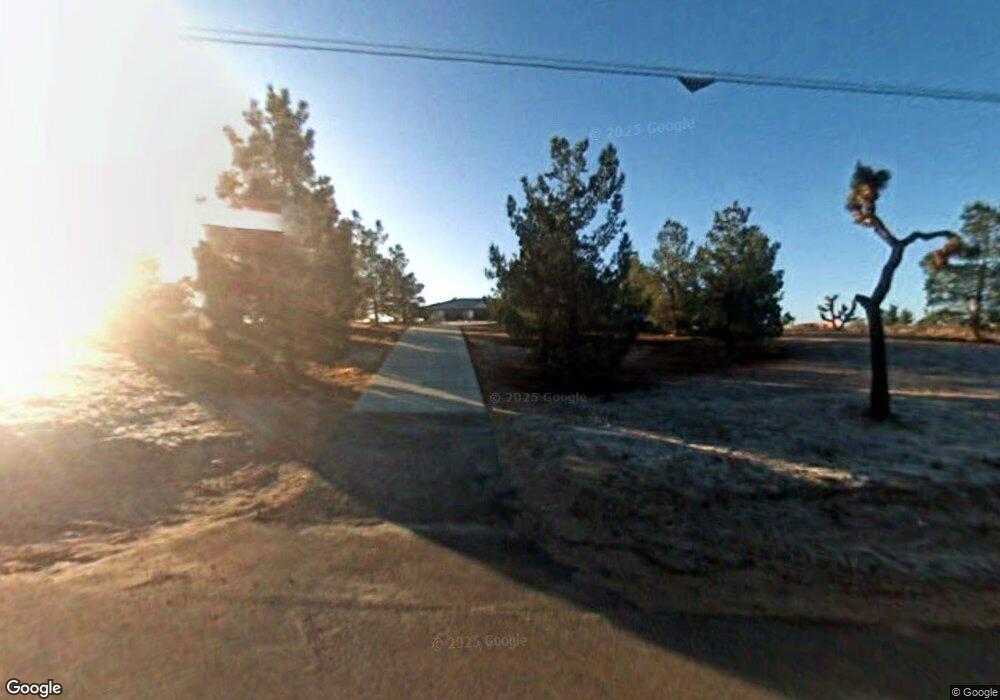
18411 Talisman St Hesperia, CA 92345
Estimated Value: $502,000 - $602,000
4
Beds
3
Baths
2,776
Sq Ft
$199/Sq Ft
Est. Value
About This Home
This home is located at 18411 Talisman St, Hesperia, CA 92345 and is currently estimated at $553,578, approximately $199 per square foot. 18411 Talisman St is a home located in San Bernardino County with nearby schools including Carmel Elementary School, Ranchero Middle School, and Sultana High School.
Ownership History
Date
Name
Owned For
Owner Type
Purchase Details
Closed on
Jul 7, 2022
Sold by
Drake Margaret R and Drake Michael J
Bought by
Michael Halloran And Margaret Drake 2022 Trus
Current Estimated Value
Purchase Details
Closed on
Sep 13, 2021
Sold by
Drake Margaret R and Halloran Michael J
Bought by
Drake Margaret R and Halloran Michael J
Home Financials for this Owner
Home Financials are based on the most recent Mortgage that was taken out on this home.
Original Mortgage
$217,160
Interest Rate
2.8%
Mortgage Type
New Conventional
Purchase Details
Closed on
Mar 13, 2001
Sold by
Jost William M and Jost Maria T
Bought by
Raef William Douglas and Drake Margaret E
Home Financials for this Owner
Home Financials are based on the most recent Mortgage that was taken out on this home.
Original Mortgage
$121,600
Interest Rate
6.98%
Purchase Details
Closed on
Oct 3, 2000
Sold by
Jost William M and Jost Maria T
Bought by
Jost William Morrison and Jost Maria Teresa
Create a Home Valuation Report for This Property
The Home Valuation Report is an in-depth analysis detailing your home's value as well as a comparison with similar homes in the area
Home Values in the Area
Average Home Value in this Area
Purchase History
| Date | Buyer | Sale Price | Title Company |
|---|---|---|---|
| Michael Halloran And Margaret Drake 2022 Trus | -- | None Listed On Document | |
| Drake Margaret R | -- | Stewart Title Guaranty Co | |
| Raef William Douglas | $152,000 | Chicago Title Company | |
| Jost William Morrison | -- | -- |
Source: Public Records
Mortgage History
| Date | Status | Borrower | Loan Amount |
|---|---|---|---|
| Previous Owner | Drake Margaret R | $217,160 | |
| Previous Owner | Raef William Douglas | $121,600 |
Source: Public Records
Tax History Compared to Growth
Tax History
| Year | Tax Paid | Tax Assessment Tax Assessment Total Assessment is a certain percentage of the fair market value that is determined by local assessors to be the total taxable value of land and additions on the property. | Land | Improvement |
|---|---|---|---|---|
| 2025 | $2,440 | $229,047 | $38,939 | $190,108 |
| 2024 | $2,440 | $224,555 | $38,175 | $186,380 |
| 2023 | $2,412 | $220,151 | $37,426 | $182,725 |
| 2022 | $2,427 | $215,834 | $36,692 | $179,142 |
| 2021 | $2,312 | $211,602 | $35,973 | $175,629 |
| 2020 | $2,284 | $209,432 | $35,604 | $173,828 |
| 2019 | $2,236 | $205,326 | $34,906 | $170,420 |
| 2018 | $2,192 | $201,300 | $34,222 | $167,078 |
| 2017 | $2,152 | $197,353 | $33,551 | $163,802 |
| 2016 | $2,105 | $193,483 | $32,893 | $160,590 |
| 2015 | $2,077 | $190,577 | $32,399 | $158,178 |
| 2014 | $2,048 | $186,844 | $31,764 | $155,080 |
Source: Public Records
Map
Nearby Homes
- 18333 Talisman St
- 18476 Talisman St
- 18441 Verano St
- 18238 Talisman St
- 0 Jacaranda Unit CV24240940
- 18635 Verano St
- 18785 Talisman St
- 11389 Jacaranda Ave
- 18135 Valencia St
- 18014 Talisman St
- 18125 Hackberry St
- 10765 Choiceana Ave
- 11562 Orchid Ave
- 17933 Deodar St
- 18299 Alder St
- 17840 Talisman St
- 10656 Choiceana Ave
- 18021 Birch St
- 10903 E Ave
- 17796 Valencia St
- 18375 Talisman St
- 18409 Talisman St
- 18410 Verano St
- 18430 Verano St
- 18380 Verano St
- 18360 Verano St
- 18408 Talisman St
- 18374 Talisman St
- 10988 Orchid Ave
- 18446 Verano St
- 18471 Talisman St
- 10964 Orchid Ave
- 18350 Verano St
- 18340 Talisman St
- 10940 Orchid Ave
- 18305 Talisman St
- 18389 Verano St
- 18338 Verano St
- 41515 Verano St Unit 92345
- 41515 Verano St