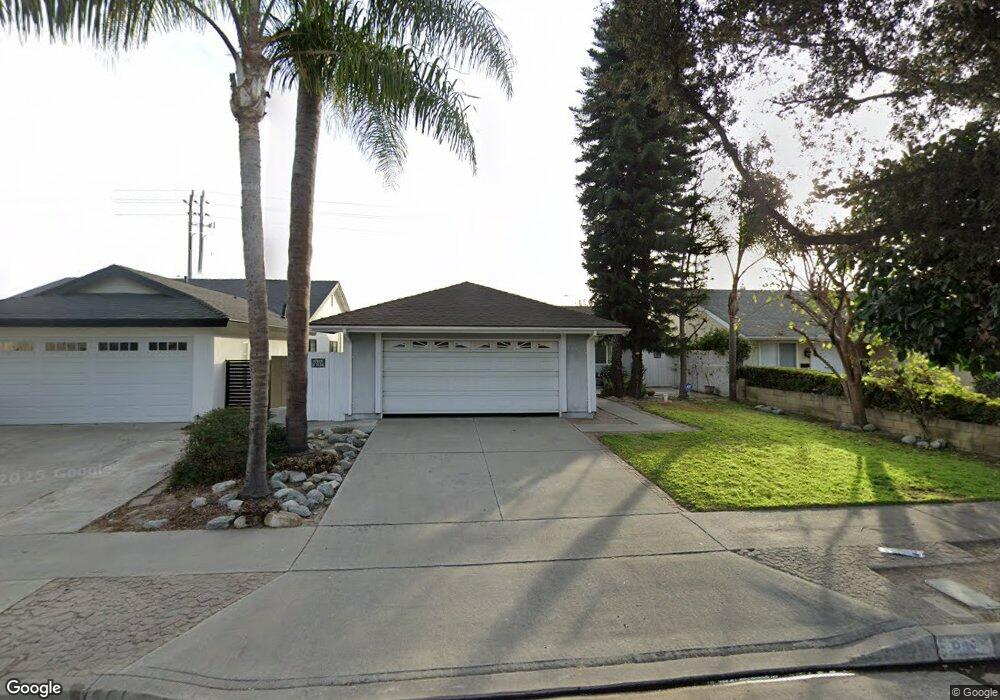
18432 De Bie Ave Cerritos, CA 90703
Estimated Value: $980,009 - $1,229,000
3
Beds
2
Baths
1,122
Sq Ft
$959/Sq Ft
Est. Value
About This Home
This home is located at 18432 De Bie Ave, Cerritos, CA 90703 and is currently estimated at $1,076,002, approximately $959 per square foot. 18432 De Bie Ave is a home located in Los Angeles County with nearby schools including Frank C. Leal Elementary School, Tetzlaff (Martin B.) Middle School, and Cerritos High School.
Ownership History
Date
Name
Owned For
Owner Type
Purchase Details
Closed on
Jan 28, 2023
Sold by
Lee Lydia Sue Hee
Bought by
Lee Lydia Sue Hee
Current Estimated Value
Purchase Details
Closed on
Nov 17, 2003
Sold by
Chung Jae Kwa and Chung Sung Ja
Bought by
Chung Lydia Sue Hee
Purchase Details
Closed on
Sep 1, 1999
Sold by
Arosteguy Jeffrey S and Arosteguy Lisa
Bought by
Chung Jae Kwa
Home Financials for this Owner
Home Financials are based on the most recent Mortgage that was taken out on this home.
Original Mortgage
$216,000
Interest Rate
7.77%
Purchase Details
Closed on
Jul 15, 1996
Sold by
Ford Joseph James
Bought by
Arosteguy Jeffery S and Arosteguy Lisa
Home Financials for this Owner
Home Financials are based on the most recent Mortgage that was taken out on this home.
Original Mortgage
$161,975
Interest Rate
8.18%
Create a Home Valuation Report for This Property
The Home Valuation Report is an in-depth analysis detailing your home's value as well as a comparison with similar homes in the area
Home Values in the Area
Average Home Value in this Area
Purchase History
| Date | Buyer | Sale Price | Title Company |
|---|---|---|---|
| Lee Lydia Sue Hee | -- | Accommodation/Courtesy Recordi | |
| Chung Lydia Sue Hee | $135,500 | Chicago Title Co | |
| Chung Jae Kwa | $240,000 | Commonwealth Land Title Co | |
| Arosteguy Jeffery S | $170,500 | Continental Lawyers Title Co |
Source: Public Records
Mortgage History
| Date | Status | Borrower | Loan Amount |
|---|---|---|---|
| Previous Owner | Chung Jae Kwa | $216,000 | |
| Previous Owner | Arosteguy Jeffery S | $161,975 |
Source: Public Records
Tax History Compared to Growth
Tax History
| Year | Tax Paid | Tax Assessment Tax Assessment Total Assessment is a certain percentage of the fair market value that is determined by local assessors to be the total taxable value of land and additions on the property. | Land | Improvement |
|---|---|---|---|---|
| 2025 | $6,434 | $534,575 | $355,440 | $179,135 |
| 2024 | $6,434 | $524,094 | $348,471 | $175,623 |
| 2023 | $6,224 | $513,819 | $341,639 | $172,180 |
| 2022 | $6,129 | $503,745 | $334,941 | $168,804 |
| 2021 | $5,988 | $493,869 | $328,374 | $165,495 |
| 2019 | $5,850 | $479,223 | $318,635 | $160,588 |
| 2018 | $5,427 | $469,828 | $312,388 | $157,440 |
| 2016 | $5,216 | $451,585 | $300,258 | $151,327 |
| 2015 | $5,150 | $444,802 | $295,748 | $149,054 |
| 2014 | $5,049 | $436,090 | $289,955 | $146,135 |
Source: Public Records
Map
Nearby Homes
- 13044 Hedda Ln
- 18006 Point Conception Place
- 13210 Sutton St
- 19008 Jeffrey Ave
- 19118 Martha Ave
- 13010 Artesia Blvd
- 18517 Betty Way
- 12711 Castleford Ln
- 19335 Derbyshire Ln
- 12360 Hedda Dr
- 12525 Semora St
- 0 Parcel: 7016-014-017 Ave Unit PW25183248
- 12361 Caravel Place
- 12356 Reva St
- 12967 Moorshire Dr
- 7862 Squaw Valley Way
- 7152 Caprice Cir
- 13370 Holly Oak Cir
- 12251 Carver Ln
- 19657 Sequoia Ave
- 18426 De Bie Ave
- 18436 De Bie Ave
- 18422 De Bie Ave
- 18502 De Bie Ave
- 12947 Arabella Place
- 18506 De Bie Ave
- 18414 De Bie Ave
- 18423 Jeffrey Ave
- 12946 Hedda St
- 12946 Arabella Place
- 12941 Arabella Place
- 18417 Jeffrey Ave
- 18503 Jeffrey Ave
- 18512 De Bie Ave
- 18410 De Bie Ave
- 18411 Jeffrey Ave
- 18507 Jeffrey Ave
- 12940 Hedda St
- 12940 Arabella Place
- 12937 Arabella Place