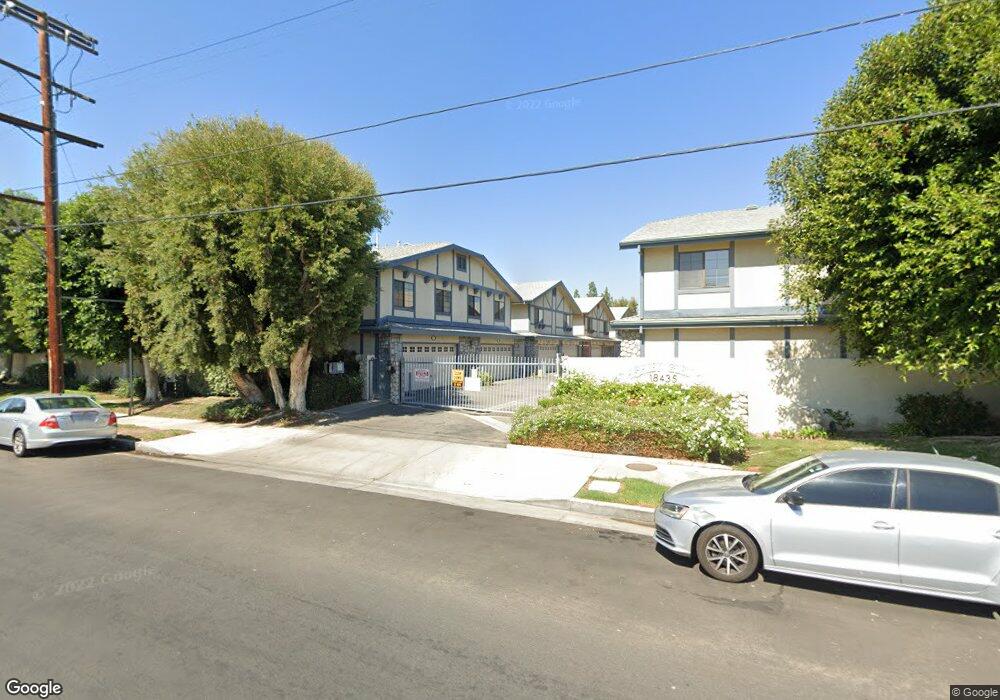
18435 Keswick St Unit 25 Reseda, CA 91335
Estimated Value: $632,000 - $663,000
3
Beds
3
Baths
1,609
Sq Ft
$398/Sq Ft
Est. Value
About This Home
This home is located at 18435 Keswick St Unit 25, Reseda, CA 91335 and is currently estimated at $641,078, approximately $398 per square foot. 18435 Keswick St Unit 25 is a home located in Los Angeles County with nearby schools including Garden Grove Elementary School, Northridge Middle School, and Northridge Academy High.
Ownership History
Date
Name
Owned For
Owner Type
Purchase Details
Closed on
Mar 24, 2018
Sold by
Rinehart Deanna
Bought by
Rinehart Deanna Lee and The Deanna Rinehart Living Trust
Current Estimated Value
Purchase Details
Closed on
Aug 23, 2010
Sold by
Watkins Rosalind and Watkins Trust
Bought by
Rinehart Deanna
Home Financials for this Owner
Home Financials are based on the most recent Mortgage that was taken out on this home.
Original Mortgage
$175,250
Outstanding Balance
$115,740
Interest Rate
4.52%
Mortgage Type
New Conventional
Estimated Equity
$525,338
Purchase Details
Closed on
Aug 7, 2003
Sold by
Watkins Rosalind
Bought by
Watkins Rosalind and Watkins Trust
Purchase Details
Closed on
Jan 27, 2003
Sold by
Watkins Rosalind
Bought by
Watkins Rosalind and The Watkins Trust
Home Financials for this Owner
Home Financials are based on the most recent Mortgage that was taken out on this home.
Original Mortgage
$141,000
Interest Rate
5.83%
Purchase Details
Closed on
Nov 9, 2001
Sold by
Watkins Rosalind
Bought by
Watkins Rosalind and Watkins Trust
Create a Home Valuation Report for This Property
The Home Valuation Report is an in-depth analysis detailing your home's value as well as a comparison with similar homes in the area
Home Values in the Area
Average Home Value in this Area
Purchase History
| Date | Buyer | Sale Price | Title Company |
|---|---|---|---|
| Rinehart Deanna Lee | -- | None Available | |
| Rinehart Deanna | $300,000 | Fidelity Van Nuys | |
| Watkins Rosalind | -- | -- | |
| Watkins Rosalind | -- | Fidelity National Title Co | |
| Watkins Rosalind | -- | Fidelity National Title Co | |
| Watkins Rosalind | -- | -- |
Source: Public Records
Mortgage History
| Date | Status | Borrower | Loan Amount |
|---|---|---|---|
| Open | Rinehart Deanna | $175,250 | |
| Previous Owner | Watkins Rosalind | $141,000 |
Source: Public Records
Tax History Compared to Growth
Tax History
| Year | Tax Paid | Tax Assessment Tax Assessment Total Assessment is a certain percentage of the fair market value that is determined by local assessors to be the total taxable value of land and additions on the property. | Land | Improvement |
|---|---|---|---|---|
| 2025 | $4,690 | $384,338 | $169,877 | $214,461 |
| 2024 | $4,690 | $376,803 | $166,547 | $210,256 |
| 2023 | $4,600 | $369,416 | $163,282 | $206,134 |
| 2022 | $4,387 | $362,174 | $160,081 | $202,093 |
| 2021 | $4,326 | $355,074 | $156,943 | $198,131 |
| 2019 | $4,195 | $344,544 | $152,289 | $192,255 |
| 2018 | $4,141 | $337,789 | $149,303 | $188,486 |
| 2016 | $3,943 | $324,674 | $143,506 | $181,168 |
| 2015 | $3,885 | $319,798 | $141,351 | $178,447 |
| 2014 | $3,902 | $313,535 | $138,583 | $174,952 |
Source: Public Records
Map
Nearby Homes
- 18352 Keswick St Unit 2
- 18347 Saticoy St Unit 37
- 7625 Reseda Blvd Unit 302
- 7725 Nestle Ave
- 18540 Arminta St
- 7512 Amigo Ave
- 7732 Garden Grove Ave
- 7700 Rhea Ave
- 8031 Canby Ave Unit 4
- 18361 Strathern St Unit 3
- 8055 Canby Ave Unit 5
- 7418 Amigo Ave
- 7434 Nestle Ave
- 18750 Keswick St
- 8051 Etiwanda Ave
- 8045 Garden Grove Ave
- 8110 Canby Ave Unit 3
- 8060 Canby Ave Unit 2
- 8134 Baird Ave
- 7650 Wilbur Ave
- 18435 Keswick St
- 18435 Keswick St Unit 27
- 18435 Keswick St Unit 26
- 18435 Keswick St Unit 24
- 18435 Keswick St Unit 23
- 18435 Keswick St Unit 22
- 18435 Keswick St Unit 21
- 18435 Keswick St Unit 20
- 18435 Keswick St Unit 19
- 18435 Keswick St Unit 18
- 18435 Keswick St Unit 17
- 18435 Keswick St Unit 16
- 18435 Keswick St Unit 15
- 18435 Keswick St Unit 14
- 18435 Keswick St Unit 13
- 18435 Keswick St Unit 12
- 18435 Keswick St Unit 11
- 18435 Keswick St Unit 10
- 18435 Keswick St Unit 9
- 18435 Keswick St Unit 8