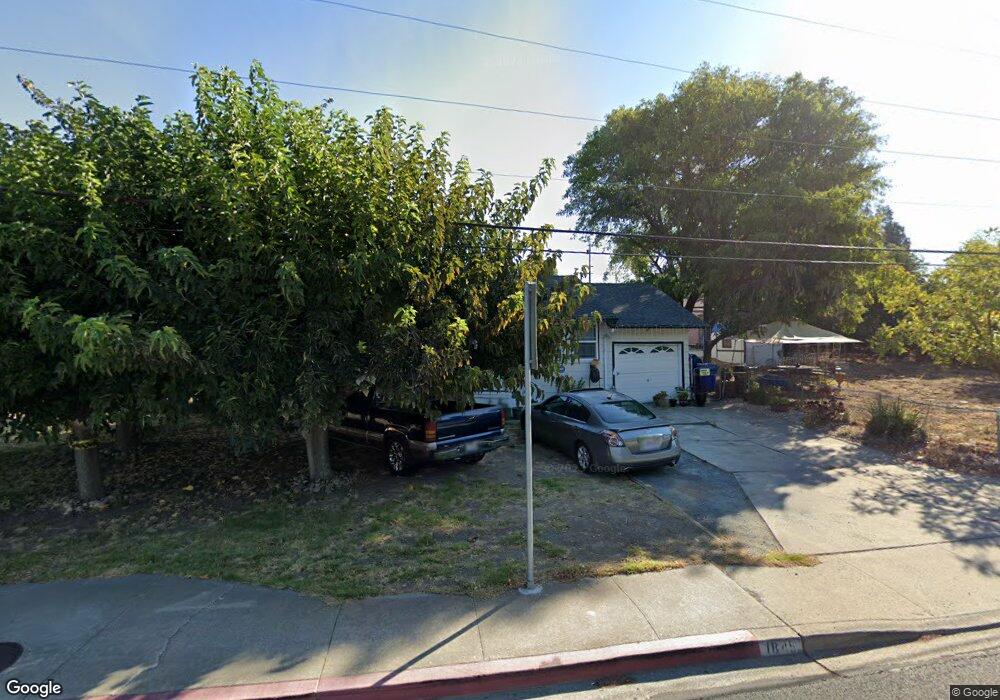
1845 Solano Way Concord, CA 94520
Buchanan Field NeighborhoodEstimated Value: $536,961 - $603,000
2
Beds
1
Bath
930
Sq Ft
$610/Sq Ft
Est. Value
About This Home
This home is located at 1845 Solano Way, Concord, CA 94520 and is currently estimated at $567,490, approximately $610 per square foot. 1845 Solano Way is a home located in Contra Costa County with nearby schools including Sun Terrace Elementary School, El Dorado Middle School, and Mt. Diablo High School.
Ownership History
Date
Name
Owned For
Owner Type
Purchase Details
Closed on
Oct 26, 2013
Sold by
Bartolomei Vicky
Bought by
Bartolomei Jim
Current Estimated Value
Purchase Details
Closed on
Jan 22, 2002
Sold by
Bartolomei Vicky and Bartolomei Tim
Bought by
Bartolomei Tim and Bartolomei Vicky
Home Financials for this Owner
Home Financials are based on the most recent Mortgage that was taken out on this home.
Original Mortgage
$139,000
Outstanding Balance
$57,327
Interest Rate
7.17%
Mortgage Type
Purchase Money Mortgage
Estimated Equity
$510,163
Purchase Details
Closed on
May 19, 1999
Sold by
Marinello and Shirley
Bought by
Bartolomei Tim L and Mcdonald Vicky
Home Financials for this Owner
Home Financials are based on the most recent Mortgage that was taken out on this home.
Original Mortgage
$87,750
Interest Rate
9.95%
Mortgage Type
Purchase Money Mortgage
Purchase Details
Closed on
May 5, 1999
Sold by
Marinello Albert and Marinello Constance
Bought by
Marinello Charles and Marinello Shirley
Home Financials for this Owner
Home Financials are based on the most recent Mortgage that was taken out on this home.
Original Mortgage
$87,750
Interest Rate
9.95%
Mortgage Type
Purchase Money Mortgage
Create a Home Valuation Report for This Property
The Home Valuation Report is an in-depth analysis detailing your home's value as well as a comparison with similar homes in the area
Home Values in the Area
Average Home Value in this Area
Purchase History
| Date | Buyer | Sale Price | Title Company |
|---|---|---|---|
| Bartolomei Jim | -- | None Available | |
| Bartolomei Tim | -- | North American Title Co | |
| Bartolomei Tim L | $117,000 | American Title Co | |
| Marinello Charles | -- | American Title Co |
Source: Public Records
Mortgage History
| Date | Status | Borrower | Loan Amount |
|---|---|---|---|
| Open | Bartolomei Tim | $139,000 | |
| Closed | Bartolomei Tim L | $87,750 | |
| Closed | Bartolomei Tim L | $22,550 |
Source: Public Records
Tax History
| Year | Tax Paid | Tax Assessment Tax Assessment Total Assessment is a certain percentage of the fair market value that is determined by local assessors to be the total taxable value of land and additions on the property. | Land | Improvement |
|---|---|---|---|---|
| 2025 | $3,037 | $183,396 | $122,269 | $61,127 |
| 2024 | $2,869 | $179,801 | $119,872 | $59,929 |
| 2023 | $2,869 | $176,276 | $117,522 | $58,754 |
| 2022 | $2,809 | $172,820 | $115,218 | $57,602 |
| 2021 | $2,724 | $169,432 | $112,959 | $56,473 |
| 2019 | $2,658 | $164,408 | $109,609 | $54,799 |
| 2018 | $2,548 | $161,185 | $107,460 | $53,725 |
| 2017 | $2,449 | $158,025 | $105,353 | $52,672 |
| 2016 | $2,356 | $154,928 | $103,288 | $51,640 |
| 2015 | $2,300 | $152,602 | $101,737 | $50,865 |
| 2014 | $2,234 | $149,614 | $99,745 | $49,869 |
Source: Public Records
Map
Nearby Homes
- 1838 Overhill Rd
- 2829 Hilltop Rd
- 2868 Avon Ave
- 2831 Richard Ave
- 2067 Olivera Rd Unit B
- 2819 Kay Ave
- 2069 Olivera Rd Unit E
- 2097 Dalis Dr Unit 79
- 2197 Dalis Dr Unit 124
- 2339 Dalis Dr Unit 193
- 2102 Overhill Rd
- 2719 Edward Ave
- 2917 Knoll Dr
- 2766 Argyll Ave
- 315 Vía Valencia Unit 138
- 2780 Argyll Ave
- 344 Via Valencia Unit 130
- 2227 Dalis Dr Unit 159
- 286 Sudan Loop
- 235 Hieber Dr Unit 265
- 2804 Hilltop Rd
- 1849 Solano Way
- 2808 Hilltop Rd
- 1799 Solano Way
- 1818 Overhill Rd
- 1851 Solano Way
- 2801 Hilltop Rd
- 1824 Overhill Rd
- 2805 Hilltop Rd
- 1853 Solano Way
- 2809 Hilltop Rd
- 1832 Overhill Rd
- 2810 Hilltop Rd
- 1819 Overhill Rd
- 1854 Solano Way
- 1825 Overhill Rd
- 2816 Hilltop Rd
- 1855 Solano Way
- 1844 Overhill Rd
- 2817 Hilltop Rd
Your Personal Tour Guide
Ask me questions while you tour the home.