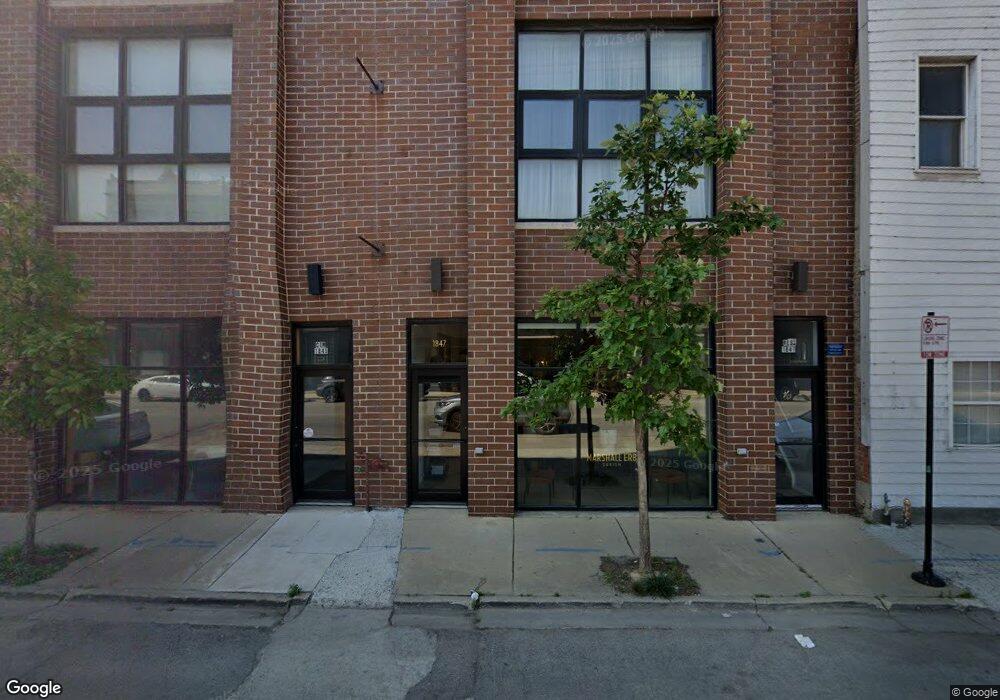
1847 W Grand Ave Unit 2 Chicago, IL 60622
West Town NeighborhoodEstimated Value: $526,000 - $691,000
2
Beds
2
Baths
1,800
Sq Ft
$320/Sq Ft
Est. Value
About This Home
This home is located at 1847 W Grand Ave Unit 2, Chicago, IL 60622 and is currently estimated at $575,765, approximately $319 per square foot. 1847 W Grand Ave Unit 2 is a home located in Cook County with nearby schools including Talcott Elementary School, Wells Community Academy High School, and Rauner College Prep.
Ownership History
Date
Name
Owned For
Owner Type
Purchase Details
Closed on
Mar 30, 2020
Sold by
Renshaw Alexander S and Renshaw Mark A
Bought by
Renshaw Alexander S
Current Estimated Value
Home Financials for this Owner
Home Financials are based on the most recent Mortgage that was taken out on this home.
Original Mortgage
$374,000
Outstanding Balance
$329,412
Interest Rate
3.1%
Mortgage Type
New Conventional
Estimated Equity
$246,353
Purchase Details
Closed on
May 8, 2017
Sold by
Fortman Palie
Bought by
Renshaw Alexander and Renshaw Mark
Home Financials for this Owner
Home Financials are based on the most recent Mortgage that was taken out on this home.
Original Mortgage
$335,000
Interest Rate
4.12%
Mortgage Type
New Conventional
Purchase Details
Closed on
Dec 28, 2007
Sold by
Archambault Rex J
Bought by
Fortman Paul J
Home Financials for this Owner
Home Financials are based on the most recent Mortgage that was taken out on this home.
Original Mortgage
$375,250
Interest Rate
6.13%
Mortgage Type
Unknown
Create a Home Valuation Report for This Property
The Home Valuation Report is an in-depth analysis detailing your home's value as well as a comparison with similar homes in the area
Home Values in the Area
Average Home Value in this Area
Purchase History
| Date | Buyer | Sale Price | Title Company |
|---|---|---|---|
| Renshaw Alexander S | -- | National Title Solutions Inc | |
| Renshaw Alexander | $430,000 | Attorney | |
| Fortman Paul J | $395,000 | Republic Title Co |
Source: Public Records
Mortgage History
| Date | Status | Borrower | Loan Amount |
|---|---|---|---|
| Open | Renshaw Alexander S | $374,000 | |
| Closed | Renshaw Alexander | $335,000 | |
| Previous Owner | Fortman Paul J | $375,250 |
Source: Public Records
Tax History Compared to Growth
Tax History
| Year | Tax Paid | Tax Assessment Tax Assessment Total Assessment is a certain percentage of the fair market value that is determined by local assessors to be the total taxable value of land and additions on the property. | Land | Improvement |
|---|---|---|---|---|
| 2024 | $7,272 | $45,498 | $4,042 | $41,456 |
| 2023 | $7,067 | $37,780 | $1,845 | $35,935 |
| 2022 | $7,067 | $37,780 | $1,845 | $35,935 |
| 2021 | $6,927 | $37,779 | $1,844 | $35,935 |
| 2020 | $4,943 | $25,289 | $1,844 | $23,445 |
| 2019 | $4,906 | $27,849 | $1,844 | $26,005 |
| 2018 | $5,501 | $27,849 | $1,844 | $26,005 |
| 2017 | $5,142 | $27,262 | $1,627 | $25,635 |
| 2016 | $4,960 | $27,262 | $1,627 | $25,635 |
| 2015 | $4,515 | $27,262 | $1,627 | $25,635 |
| 2014 | $5,565 | $32,563 | $1,356 | $31,207 |
| 2013 | $5,444 | $32,563 | $1,356 | $31,207 |
Source: Public Records
Map
Nearby Homes
- 1812 - 1814 W Grand Ave
- 530 N Wood St Unit D
- 1934 W Race Ave
- 529 N Hartland Ct
- 1819 W Erie St
- 466 N Paulina St Unit 203
- 466 N Paulina St Unit PH-402
- 466 N Paulina St Unit PH-403
- 466 N Paulina St Unit 202
- 466 N Paulina St Unit 201
- 2049 W Race Ave
- 2055 W Race Ave
- 1830 W Huron St Unit 2
- 2035 W Erie St
- 2005 W Huron St Unit 1
- 1640 W Ohio St Unit 1R
- 1811 W Superior St
- 1956 W Huron St
- 1638 W Ontario St
- 2036 W Erie St
- 1847 W Grand Ave Unit 3
- 1847 W Grand Ave Unit 1
- 1847 W Grand Ave Unit P
- 1847 W Grand Ave Unit 18473
- 1847 W Grand Ave Unit 18472
- 1847 W Grand Ave Unit 18471
- 1847 W Grand Ave Unit C1
- 1847 W Grand Ave Unit 3
- 1847 W Grand Ave Unit 2
- 1847 W Grand Ave Unit 1
- 1847 W Grand Ave
- 1845 W Grand Ave Unit 2
- 1845 W Grand Ave Unit 3
- 1845 W Grand Ave Unit 1
- 1845 W Grand Ave Unit 18453
- 1845 W Grand Ave Unit 18452
- 1845 W Grand Ave Unit 18451
- 1845 W Grand Ave Unit 1-2
- 1845 W Grand Ave
- 1845 W Grand Ave Unit PENT