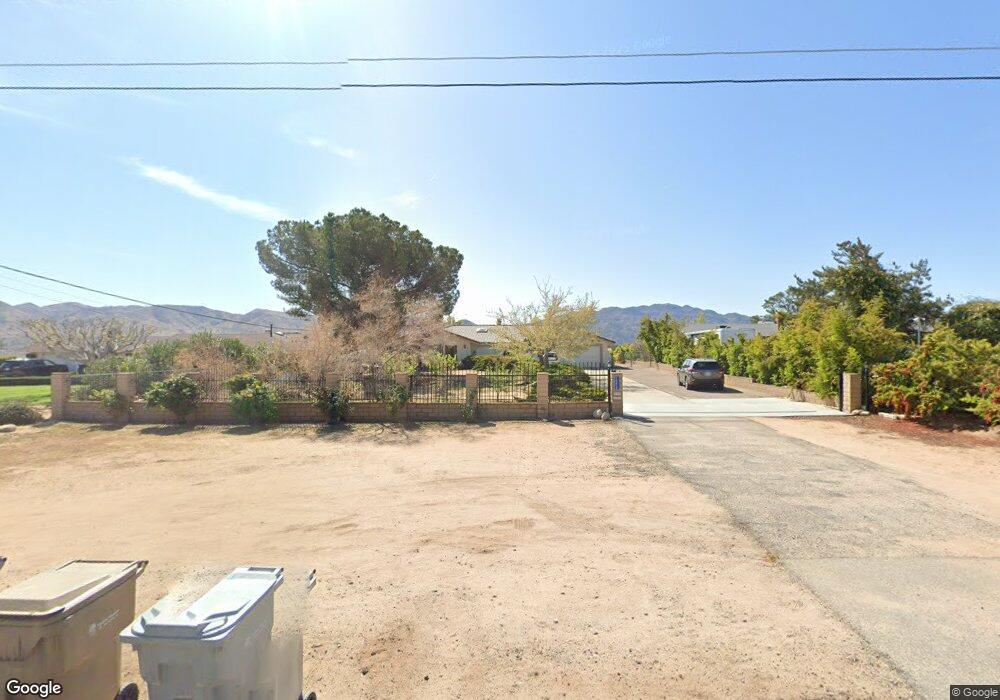
18479 Damon Dr Hesperia, CA 92345
The Mesa NeighborhoodEstimated Value: $465,185 - $486,000
3
Beds
2
Baths
1,751
Sq Ft
$270/Sq Ft
Est. Value
About This Home
This home is located at 18479 Damon Dr, Hesperia, CA 92345 and is currently estimated at $473,046, approximately $270 per square foot. 18479 Damon Dr is a home located in San Bernardino County with nearby schools including Kingston Elementary School, Ranchero Middle School, and Sultana High School.
Ownership History
Date
Name
Owned For
Owner Type
Purchase Details
Closed on
Apr 19, 2023
Sold by
Lamberson Daniel Raymond and Lamberson Catherine Lou
Bought by
Daniel R Lamberson And Catherine L Lamberson
Current Estimated Value
Purchase Details
Closed on
Nov 21, 2019
Sold by
Lamberson Catherine L and Lamberson Gilbert
Bought by
Lamberson Daniel Raymond and Lamberson Catherine Louise
Purchase Details
Closed on
Mar 29, 2012
Sold by
Thompson Mildred and Thompson Gilbert Elliot
Bought by
Thompson Gilbert E and Thompson Mildred
Purchase Details
Closed on
Sep 21, 2011
Sold by
Harding David and The Harding Trust
Bought by
Thompson Mildred and Thompson Gilbert Elliot
Purchase Details
Closed on
Jun 24, 2010
Sold by
Harding Quete C
Bought by
Harding David and The Harding Trust
Purchase Details
Closed on
Apr 28, 2010
Sold by
Harding Quete C and The A & Q Harding Trust
Bought by
Harding Quete C
Create a Home Valuation Report for This Property
The Home Valuation Report is an in-depth analysis detailing your home's value as well as a comparison with similar homes in the area
Home Values in the Area
Average Home Value in this Area
Purchase History
| Date | Buyer | Sale Price | Title Company |
|---|---|---|---|
| Daniel R Lamberson And Catherine L Lamberson | -- | None Listed On Document | |
| Lamberson Daniel Raymond | -- | None Available | |
| Thompson Gilbert E | -- | None Available | |
| Thompson Mildred | $135,000 | Chicago Title Company | |
| Harding David | -- | None Available | |
| Harding Quete C | -- | None Available |
Source: Public Records
Tax History Compared to Growth
Tax History
| Year | Tax Paid | Tax Assessment Tax Assessment Total Assessment is a certain percentage of the fair market value that is determined by local assessors to be the total taxable value of land and additions on the property. | Land | Improvement |
|---|---|---|---|---|
| 2025 | $1,824 | $169,570 | $45,785 | $123,785 |
| 2024 | $1,824 | $166,245 | $44,887 | $121,358 |
| 2023 | $1,802 | $162,985 | $44,007 | $118,978 |
| 2022 | $1,760 | $159,789 | $43,144 | $116,645 |
| 2021 | $1,727 | $156,656 | $42,298 | $114,358 |
| 2020 | $1,706 | $155,049 | $41,864 | $113,185 |
| 2019 | $1,742 | $152,009 | $41,043 | $110,966 |
| 2018 | $1,709 | $149,028 | $40,238 | $108,790 |
| 2017 | $1,679 | $146,106 | $39,449 | $106,657 |
| 2016 | $1,644 | $143,241 | $38,675 | $104,566 |
| 2015 | $1,623 | $141,089 | $38,094 | $102,995 |
| 2014 | $1,602 | $138,325 | $37,348 | $100,977 |
Source: Public Records
Map
Nearby Homes
- 18626 Ranchero Rd
- 7469 Madera Ave
- 7601 Corona Ave
- 18540 Fairburn St
- 7614 Calpella Ave
- 18110 Fairburn St
- 7762 Madera Ave
- 0 Whisper Ln Unit IV25244814
- 0 Paisley Ave
- 0 Ranchero E Unit HD24112614
- 0 Ranchero E Unit HD25251825
- 0 Ranchero E Unit HD25251827
- 7935 Gaylop Ave
- 7714 Paisley Ave
- 0 Ranchero Rd Unit HD25189233
- 7697 Windsor Ave
- 7939 Lassen Ave
- 18540 Seaforth St
- 18010 Seaforth St
- 17995 Seaforth St
- 18493 Damon Dr
- 18469 Damon Dr
- 18507 Damon Dr
- 18457 Damon Dr
- 0 Damon Dr Unit SW18229838
- 0 Damon Dr Unit IV13145939
- 0 Damon St Unit HM13210599
- 0 Damon Dr Unit HD22218739
- 0 Damon Dr Unit 414950
- 0 Damon Dr Unit 537545
- 0 Damon Dr Unit 339383
- 0 Damon Dr Unit 360392
- 0 Damon Dr Unit 368409
- 0 Damon Dr Unit 386477
- 0 Damon Dr Unit 399731
- 0 Damon Dr Unit 401800
- 0 Damon St Unit 431727
- 0 Damon St Unit 428742
- 0 Damon St Unit 425076
- 0 Damon St Unit SW18229838