Estimated Value: $844,000 - $896,000
7
Beds
3
Baths
3,644
Sq Ft
$240/Sq Ft
Est. Value
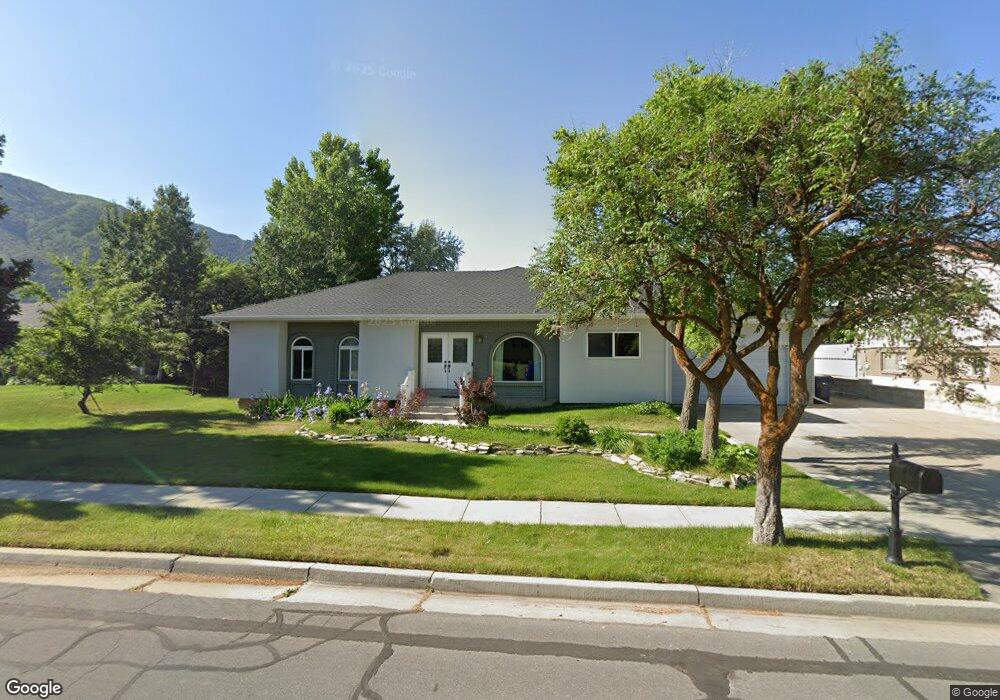
About This Home
This home is located at 1848 E Crescent View Dr, Sandy, UT 84092 and is currently estimated at $873,057, approximately $239 per square foot. 1848 E Crescent View Dr is a home located in Salt Lake County with nearby schools including Sunrise Elementary School, Bell Canyon Montessori School, and Challenger School - Sandy.
Ownership History
Date
Name
Owned For
Owner Type
Purchase Details
Closed on
Dec 8, 2020
Sold by
Jones Rychen and Jones Annalise
Bought by
Lloyd Jacob
Current Estimated Value
Home Financials for this Owner
Home Financials are based on the most recent Mortgage that was taken out on this home.
Original Mortgage
$360,000
Outstanding Balance
$321,079
Interest Rate
2.8%
Mortgage Type
New Conventional
Estimated Equity
$551,978
Purchase Details
Closed on
Mar 23, 2020
Sold by
Jones Rychen
Bought by
Jones Rychen and Jones Annalise
Home Financials for this Owner
Home Financials are based on the most recent Mortgage that was taken out on this home.
Original Mortgage
$315,000
Interest Rate
3.4%
Mortgage Type
New Conventional
Purchase Details
Closed on
Jan 24, 2018
Sold by
Mckay Martin and Mckay Sarah
Bought by
Jones Rychen and Jones Annalise
Home Financials for this Owner
Home Financials are based on the most recent Mortgage that was taken out on this home.
Original Mortgage
$260,000
Interest Rate
3.93%
Mortgage Type
New Conventional
Purchase Details
Closed on
Nov 26, 2013
Sold by
Federal National Mortgage Association
Bought by
Mckay Martin and Mckay Sarah
Home Financials for this Owner
Home Financials are based on the most recent Mortgage that was taken out on this home.
Original Mortgage
$275,025
Interest Rate
3.75%
Mortgage Type
FHA
Purchase Details
Closed on
May 10, 2012
Sold by
Mccleery David B and Chase Bank Usa Na
Bought by
Federal National Mortgage Association
Purchase Details
Closed on
Nov 23, 2004
Sold by
Metrocor Inc
Bought by
Mccleery David B
Home Financials for this Owner
Home Financials are based on the most recent Mortgage that was taken out on this home.
Original Mortgage
$264,000
Interest Rate
7.1%
Mortgage Type
New Conventional
Purchase Details
Closed on
Nov 2, 2004
Sold by
Mccleery David B
Bought by
Metrocor Inc
Home Financials for this Owner
Home Financials are based on the most recent Mortgage that was taken out on this home.
Original Mortgage
$264,000
Interest Rate
7.1%
Mortgage Type
New Conventional
Purchase Details
Closed on
Sep 28, 2004
Sold by
Mccleery David B
Bought by
Vcmc Inc
Home Financials for this Owner
Home Financials are based on the most recent Mortgage that was taken out on this home.
Original Mortgage
$264,000
Interest Rate
7.1%
Mortgage Type
New Conventional
Purchase Details
Closed on
Nov 9, 1999
Sold by
Mccleery Val M and Mccleery Casse M
Bought by
Mccleery David B
Create a Home Valuation Report for This Property
The Home Valuation Report is an in-depth analysis detailing your home's value as well as a comparison with similar homes in the area
Home Values in the Area
Average Home Value in this Area
Purchase History
| Date | Buyer | Sale Price | Title Company |
|---|---|---|---|
| Lloyd Jacob | -- | Backman Title Services | |
| Jones Rychen | -- | Real Advantage Ttl Ins Agcy | |
| Jones Rychen | -- | Real Advantage Ttl Ins Agcy | |
| Jones Rychen | -- | None Available | |
| Mckay Martin | -- | Backman Title Services | |
| Federal National Mortgage Association | -- | None Available | |
| Mccleery David B | -- | -- | |
| Metrocor Inc | -- | -- | |
| Mccleery David B | -- | Wasatch Title Ins Agency Llc | |
| Vcmc Inc | -- | -- | |
| Mccleery David B | -- | -- |
Source: Public Records
Mortgage History
| Date | Status | Borrower | Loan Amount |
|---|---|---|---|
| Open | Lloyd Jacob | $360,000 | |
| Previous Owner | Jones Rychen | $315,000 | |
| Previous Owner | Jones Rychen | $260,000 | |
| Previous Owner | Mckay Martin | $275,025 | |
| Previous Owner | Mccleery David B | $264,000 | |
| Closed | Mccleery David B | $66,000 |
Source: Public Records
Tax History
| Year | Tax Paid | Tax Assessment Tax Assessment Total Assessment is a certain percentage of the fair market value that is determined by local assessors to be the total taxable value of land and additions on the property. | Land | Improvement |
|---|---|---|---|---|
| 2025 | $4,191 | $772,700 | $269,500 | $503,200 |
| 2024 | $4,191 | $775,100 | $259,400 | $515,700 |
| 2023 | $3,806 | $701,800 | $249,500 | $452,300 |
| 2022 | $3,952 | $711,900 | $244,600 | $467,300 |
| 2021 | $3,517 | $539,300 | $197,700 | $341,600 |
| 2020 | $2,997 | $433,300 | $197,700 | $235,600 |
| 2019 | $2,864 | $403,500 | $186,500 | $217,000 |
| 2016 | $2,301 | $311,800 | $168,000 | $143,800 |
Source: Public Records
Map
Nearby Homes
- 11318 Canyon Falls Ln
- 11382 S Canyon Falls Ln
- 1653 Crescent View Dr
- 11341 S Silver Buckle Way
- 11129 S 2125 E
- 10868 Prescott Dr
- 2234 E Willow Brook Way
- 7 Rollingwood Ln
- 11343 Clifford Cir
- 2192 E High Mesa Dr
- 1320 E Woodhill Cir
- 2026 E 10765 S
- 2250 High Mountain Dr
- 2232 E Lone Eagle Ln
- 16 Gatehouse Ln
- 11446 S 2320 E
- 1 Quietwood Ln
- 1234 E Sandy Ridge Dr
- 5 Quietwood Ln
- 11755 S Canberra Dr
- 1848 Crescent View Dr
- 1838 Crescent View Dr
- 1858 Crescent View Dr
- 1858 E Crescent View Dr
- 1838 E Crescent View Dr
- 1853 Crescent View Dr
- 1843 E Crescent View Dr
- 1843 Crescent View Dr
- 1828 Crescent View Dr
- 1809 E Canyon Falls Ln
- 1868 Crescent View Dr
- 1863 Crescent View Dr
- 1833 Crescent View Dr
- 1818 E Crescent View Dr
- 1818 Crescent View Dr
- 1820 E Teakwood Dr
- 1820 Teakwood Dr
- 1823 Crescent View Dr
- 1830 E Teakwood Dr
- 11318 Canyon Falls Ln Unit 203
Your Personal Tour Guide
Ask me questions while you tour the home.