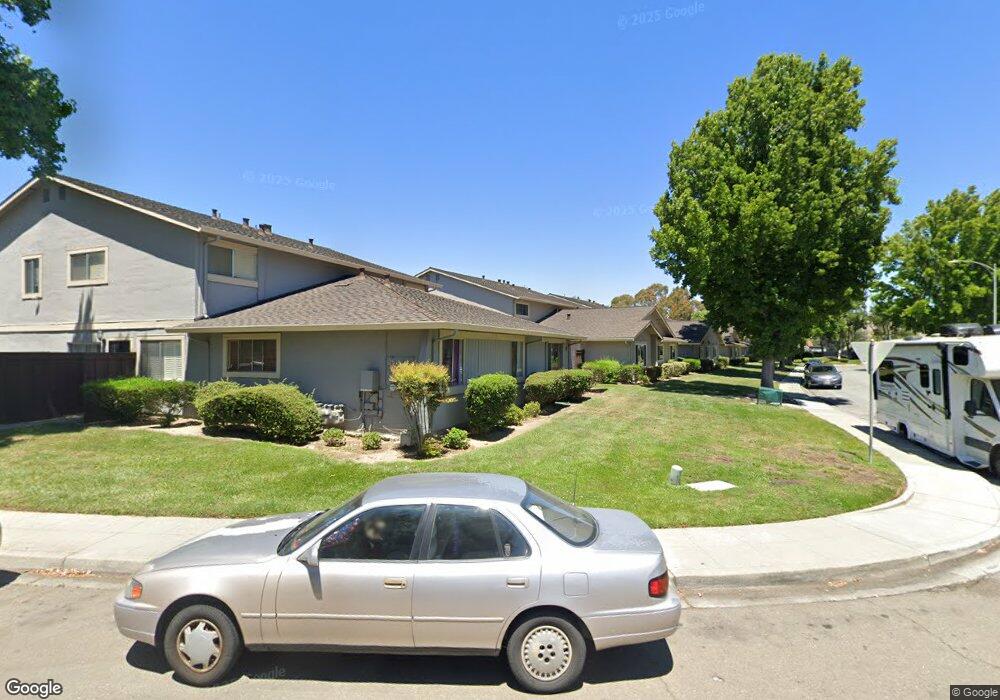
185 Ethyl Ct Unit 4 Milpitas, CA 95035
Estimated Value: $592,328 - $739,000
2
Beds
1
Bath
924
Sq Ft
$690/Sq Ft
Est. Value
About This Home
This home is located at 185 Ethyl Ct Unit 4, Milpitas, CA 95035 and is currently estimated at $637,582, approximately $690 per square foot. 185 Ethyl Ct Unit 4 is a home located in Santa Clara County with nearby schools including Anthony Spangler Elementary School, Thomas Russell Middle School, and Milpitas High School.
Ownership History
Date
Name
Owned For
Owner Type
Purchase Details
Closed on
Feb 22, 2022
Sold by
Li and Ting
Bought by
Li Ji
Current Estimated Value
Purchase Details
Closed on
Aug 15, 2014
Sold by
Chiem Nga
Bought by
Li Ji and Pan Ting
Home Financials for this Owner
Home Financials are based on the most recent Mortgage that was taken out on this home.
Original Mortgage
$255,750
Interest Rate
3.37%
Mortgage Type
Adjustable Rate Mortgage/ARM
Purchase Details
Closed on
Nov 16, 2004
Sold by
Ohta Francis
Bought by
Chiem Nga
Home Financials for this Owner
Home Financials are based on the most recent Mortgage that was taken out on this home.
Original Mortgage
$210,000
Interest Rate
5.87%
Mortgage Type
New Conventional
Purchase Details
Closed on
Feb 29, 1996
Sold by
Okumura Masanaga and The Masaharu Okumura Trust
Bought by
Ohta Francis
Home Financials for this Owner
Home Financials are based on the most recent Mortgage that was taken out on this home.
Original Mortgage
$52,000
Interest Rate
7.01%
Create a Home Valuation Report for This Property
The Home Valuation Report is an in-depth analysis detailing your home's value as well as a comparison with similar homes in the area
Home Values in the Area
Average Home Value in this Area
Purchase History
| Date | Buyer | Sale Price | Title Company |
|---|---|---|---|
| Li Ji | -- | None Listed On Document | |
| Li Ji | $341,000 | Fidelity National Title Co | |
| Chiem Nga | $280,000 | Alliance Title Company | |
| Ohta Francis | $65,000 | Old Republic Title Company |
Source: Public Records
Mortgage History
| Date | Status | Borrower | Loan Amount |
|---|---|---|---|
| Previous Owner | Li Ji | $255,750 | |
| Previous Owner | Chiem Nga | $210,000 | |
| Previous Owner | Ohta Francis | $52,000 |
Source: Public Records
Tax History
| Year | Tax Paid | Tax Assessment Tax Assessment Total Assessment is a certain percentage of the fair market value that is determined by local assessors to be the total taxable value of land and additions on the property. | Land | Improvement |
|---|---|---|---|---|
| 2025 | $4,739 | $409,822 | $204,911 | $204,911 |
| 2024 | $4,739 | $401,788 | $200,894 | $200,894 |
| 2023 | $4,723 | $393,910 | $196,955 | $196,955 |
| 2022 | $4,706 | $386,188 | $193,094 | $193,094 |
| 2021 | $4,638 | $378,616 | $189,308 | $189,308 |
| 2020 | $4,558 | $374,734 | $187,367 | $187,367 |
| 2019 | $4,507 | $367,388 | $183,694 | $183,694 |
| 2018 | $4,283 | $360,186 | $180,093 | $180,093 |
| 2017 | $4,228 | $353,124 | $176,562 | $176,562 |
| 2016 | $4,054 | $346,200 | $173,100 | $173,100 |
| 2015 | $4,013 | $341,000 | $170,500 | $170,500 |
| 2014 | $3,790 | $318,093 | $190,800 | $127,293 |
Source: Public Records
Map
Nearby Homes
- 50 Serra Way
- 353 San Miguel Ct Unit 2
- 690 Claridad Loop Unit 11E
- 295 Rio Verde Place Unit 4
- 969 Mente Linda Loop Unit 6G
- 660 S Main St
- 678 S Main St
- 646 S Main St
- 800 S Abel St Unit 100
- 45 Parc Place Dr Unit RU2808
- 175 Barker St
- 137 Caladenia Ln
- 0 Railroad Ave
- 839 Harmony Place Unit 126
- 885 Spirit Walk Unit 243
- 59 Wind Song
- 39 Cloud Walk Unit 328
- 7280 Marylinn Dr
- 170 Marylinn Dr
- 102 Marylinn Dr
- 185 Ethyl Ct Unit 4
- 185 Ethyl Ct
- 185 Ethyl Ct Unit 3
- 185 Ethyl Ct Unit 2
- 185 Ethyl Ct Unit 1
- 171 Ethyl Ct Unit 4
- 171 Ethyl Ct Unit 3
- 171 Ethyl Ct Unit 2
- 171 Ethyl Ct Unit 1
- 178 Junipero Dr Unit 2
- 178 Junipero Dr Unit 4
- 178 Junipero Dr Unit 3
- 178 Junipero Dr Unit 2
- 178 Junipero Dr Unit 1
- 192 Junipero Dr Unit 4
- 192 Junipero Dr Unit 4
- 192 Junipero Dr Unit 3
- 192 Junipero Dr Unit 2
- 192 Junipero Dr Unit 1
- 157 Ethyl Ct Unit 4
Your Personal Tour Guide
Ask me questions while you tour the home.