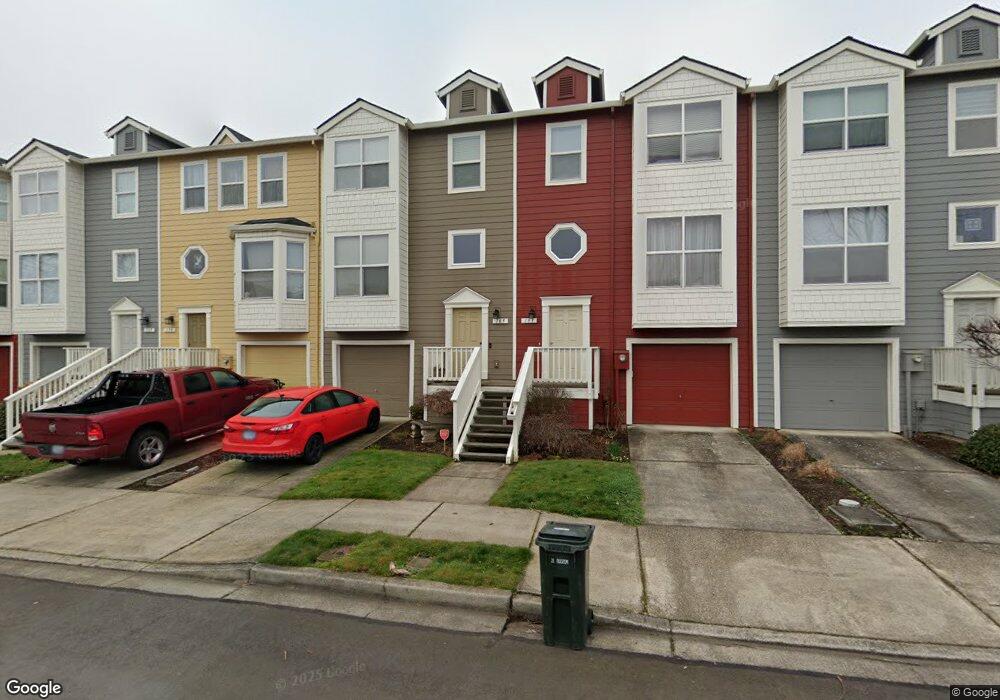
185 NW Battaglia Ave Gresham, OR 97030
Northwest Gresham NeighborhoodEstimated Value: $334,345 - $364,000
2
Beds
2
Baths
1,320
Sq Ft
$263/Sq Ft
Est. Value
About This Home
This home is located at 185 NW Battaglia Ave, Gresham, OR 97030 and is currently estimated at $346,586, approximately $262 per square foot. 185 NW Battaglia Ave is a home located in Multnomah County with nearby schools including North Gresham Elementary School, Clear Creek Middle School, and Gresham High School.
Ownership History
Date
Name
Owned For
Owner Type
Purchase Details
Closed on
Apr 12, 2005
Sold by
Fast Jeffrey L
Bought by
Johnson Sandra D
Current Estimated Value
Home Financials for this Owner
Home Financials are based on the most recent Mortgage that was taken out on this home.
Original Mortgage
$120,000
Outstanding Balance
$63,873
Interest Rate
6.37%
Mortgage Type
Purchase Money Mortgage
Estimated Equity
$282,713
Purchase Details
Closed on
Mar 26, 2002
Sold by
Bufton Greg S
Bought by
Fast Jeffrey L
Home Financials for this Owner
Home Financials are based on the most recent Mortgage that was taken out on this home.
Original Mortgage
$124,600
Interest Rate
6.84%
Mortgage Type
Purchase Money Mortgage
Purchase Details
Closed on
Sep 2, 1999
Sold by
Brownstone Homes Llc
Bought by
Bufton Greg S
Home Financials for this Owner
Home Financials are based on the most recent Mortgage that was taken out on this home.
Original Mortgage
$134,300
Interest Rate
10.37%
Mortgage Type
Purchase Money Mortgage
Create a Home Valuation Report for This Property
The Home Valuation Report is an in-depth analysis detailing your home's value as well as a comparison with similar homes in the area
Home Values in the Area
Average Home Value in this Area
Purchase History
| Date | Buyer | Sale Price | Title Company |
|---|---|---|---|
| Johnson Sandra D | $150,000 | Fidelity Natl Title Co Of Or | |
| Fast Jeffrey L | $128,500 | Chicago Title | |
| Bufton Greg S | $129,170 | Fidelity National Title Co |
Source: Public Records
Mortgage History
| Date | Status | Borrower | Loan Amount |
|---|---|---|---|
| Open | Johnson Sandra D | $120,000 | |
| Previous Owner | Fast Jeffrey L | $124,600 | |
| Previous Owner | Bufton Greg S | $134,300 | |
| Closed | Johnson Sandra D | $30,000 |
Source: Public Records
Tax History
| Year | Tax Paid | Tax Assessment Tax Assessment Total Assessment is a certain percentage of the fair market value that is determined by local assessors to be the total taxable value of land and additions on the property. | Land | Improvement |
|---|---|---|---|---|
| 2025 | $3,974 | $195,300 | -- | -- |
| 2024 | $3,805 | $189,620 | -- | -- |
| 2023 | $3,466 | $184,100 | $0 | $0 |
| 2022 | $3,369 | $178,740 | $0 | $0 |
| 2021 | $3,284 | $173,540 | $0 | $0 |
| 2020 | $3,090 | $168,490 | $0 | $0 |
| 2019 | $3,010 | $163,590 | $0 | $0 |
| 2018 | $2,870 | $158,830 | $0 | $0 |
| 2017 | $2,753 | $154,210 | $0 | $0 |
| 2016 | $2,428 | $149,720 | $0 | $0 |
| 2015 | $2,375 | $145,360 | $0 | $0 |
| 2014 | $2,292 | $141,130 | $0 | $0 |
Source: Public Records
Map
Nearby Homes
- 2590 NW 2nd Terrace
- 2543 NW 2nd Terrace
- 181 NW Mawrcrest Ave
- 185 NW Mawrcrest Ave
- 85 NW Mawrcrest Ave
- 63 NW Mawrcrest Ave
- 21 NW Mawrcrest Ave
- 296 NW Mawrcrest Ave
- 284 NW Mawrcrest Ave
- 230 NW Mawrcrest Ave
- 236 NW Mawrcrest Ave
- 256 NW Mawrcrest Ave
- 272 NW Mawrcrest Ave
- 3412 NW 1st St
- 2530 SE 190th Ave
- 970 NW Wonderview Ct Unit 980
- 195 NW Phyllis Ct
- 3893 SW 4th St
- 2442 SE 190th Ave
- 1745 NW 7th Place
- 179 NW Battaglia Ave
- 193 NW Battaglia Ave
- 199 NW Battaglia Ave
- 167 NW Battaglia Ave
- 207 NW Battaglia Ave
- 151 NW Battaglia Ave
- 213 NW Battaglia Ave
- 143 NW Battaglia Ave
- 2598 NW 2nd Terrace
- 137 NW Battaglia Ave
- 221 NW Battaglia Ave
- 2594 NW 2nd Terrace
- 129 NW Battaglia Ave
- 233 NW Battaglia Ave
- 117 NW Battaglia Ave
- 2597 NW 2nd Terrace
- 2599 NW 1st Dr
- 2588 NW 2nd Terrace
- 2595 NW 1st Dr
- 2584 NW 2nd Terrace
Your Personal Tour Guide
Ask me questions while you tour the home.