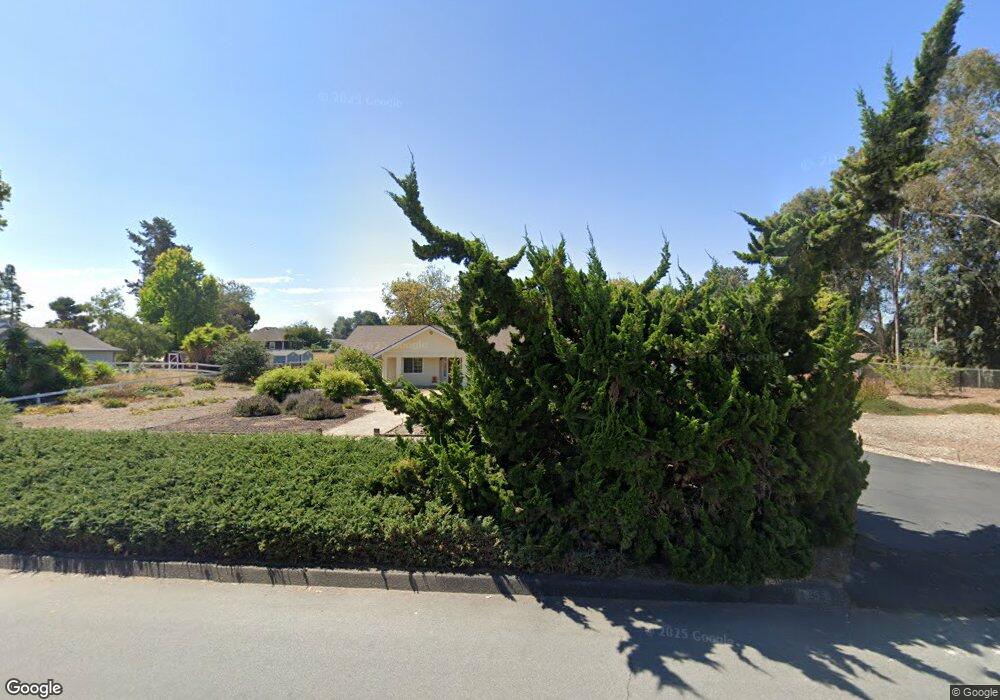
185 Verbena St Nipomo, CA 93444
Estimated Value: $809,000 - $1,099,000
3
Beds
2
Baths
1,800
Sq Ft
$539/Sq Ft
Est. Value
About This Home
This home is located at 185 Verbena St, Nipomo, CA 93444 and is currently estimated at $970,894, approximately $539 per square foot. 185 Verbena St is a home located in San Luis Obispo County with nearby schools including Dana Elementary School, Mesa Middle School, and Nipomo High School.
Ownership History
Date
Name
Owned For
Owner Type
Purchase Details
Closed on
Oct 15, 2003
Sold by
Parks Edwin W and Parks Nancy E
Bought by
Haynes John G and Haynes Barbara P
Current Estimated Value
Home Financials for this Owner
Home Financials are based on the most recent Mortgage that was taken out on this home.
Original Mortgage
$300,000
Outstanding Balance
$137,785
Interest Rate
5.98%
Mortgage Type
Unknown
Estimated Equity
$833,109
Purchase Details
Closed on
Dec 12, 1997
Sold by
Cram Charles H and Cram Joan E
Bought by
Parks Edwin W and Parks Nancy E
Home Financials for this Owner
Home Financials are based on the most recent Mortgage that was taken out on this home.
Original Mortgage
$171,000
Interest Rate
7.05%
Purchase Details
Closed on
Jun 16, 1997
Sold by
Cram Charles H and Cram Joan E
Bought by
Cram Charles H and Cram Joan E
Create a Home Valuation Report for This Property
The Home Valuation Report is an in-depth analysis detailing your home's value as well as a comparison with similar homes in the area
Home Values in the Area
Average Home Value in this Area
Purchase History
| Date | Buyer | Sale Price | Title Company |
|---|---|---|---|
| Haynes John G | $510,000 | First American Title Company | |
| Parks Edwin W | $222,000 | First American Title Co | |
| Cram Charles H | -- | -- |
Source: Public Records
Mortgage History
| Date | Status | Borrower | Loan Amount |
|---|---|---|---|
| Open | Haynes John G | $300,000 | |
| Previous Owner | Parks Edwin W | $171,000 |
Source: Public Records
Tax History
| Year | Tax Paid | Tax Assessment Tax Assessment Total Assessment is a certain percentage of the fair market value that is determined by local assessors to be the total taxable value of land and additions on the property. | Land | Improvement |
|---|---|---|---|---|
| 2025 | $7,385 | $725,094 | $362,547 | $362,547 |
| 2024 | $7,299 | $710,878 | $355,439 | $355,439 |
| 2023 | $7,299 | $696,940 | $348,470 | $348,470 |
| 2022 | $7,187 | $683,276 | $341,638 | $341,638 |
| 2021 | $7,173 | $669,880 | $334,940 | $334,940 |
| 2020 | $7,090 | $663,012 | $331,506 | $331,506 |
| 2019 | $6,552 | $605,000 | $300,000 | $305,000 |
| 2018 | $6,316 | $579,000 | $290,000 | $289,000 |
| 2017 | $5,880 | $539,000 | $270,000 | $269,000 |
| 2016 | $5,422 | $517,000 | $260,000 | $257,000 |
| 2015 | $5,203 | $496,000 | $250,000 | $246,000 |
| 2014 | $4,922 | $478,000 | $240,000 | $238,000 |
Source: Public Records
Map
Nearby Homes
- 250 Via Promesa
- 353 Uranus Ct
- 1431 La Loma Dr
- 366 Venus Ct
- 429 Saturn Ct
- 426 Polaris Dr
- 340 N Las Flores Dr
- 468 Neptune Dr
- 341 N Las Flores Dr
- 945 Jeanette Ln
- 850 Primrose Ln
- 325 Black Hawk Way
- 345 Black Hawk Way
- 219 Lema Dr
- 680 Sweet Donna Place
- 1089 Olympic Way
- 778 Primrose Ln
- 1655 Kirby Way
- 522 Higos Way
- 719 W Tefft St
- 165 Verbena St
- 180 Verbena St
- 1146 W Tefft St
- 1125 Azalea Ct
- 1145 Azalea Ct
- 160 Verbena St
- 145 Verbena St
- 220 Verbena St
- 1150 W Tefft St
- 140 Verbena St
- 1165 Azalea Ct
- 1130 Azalea Ct
- 1066 W Tefft St
- 170 Sunridge Ln
- 1075 Zinnia Ct
- 1150 Azalea Ct
- 125 Verbena St
- 120 Verbena St
- 260 Verbena St
- 1140 W Tefft St
Your Personal Tour Guide
Ask me questions while you tour the home.