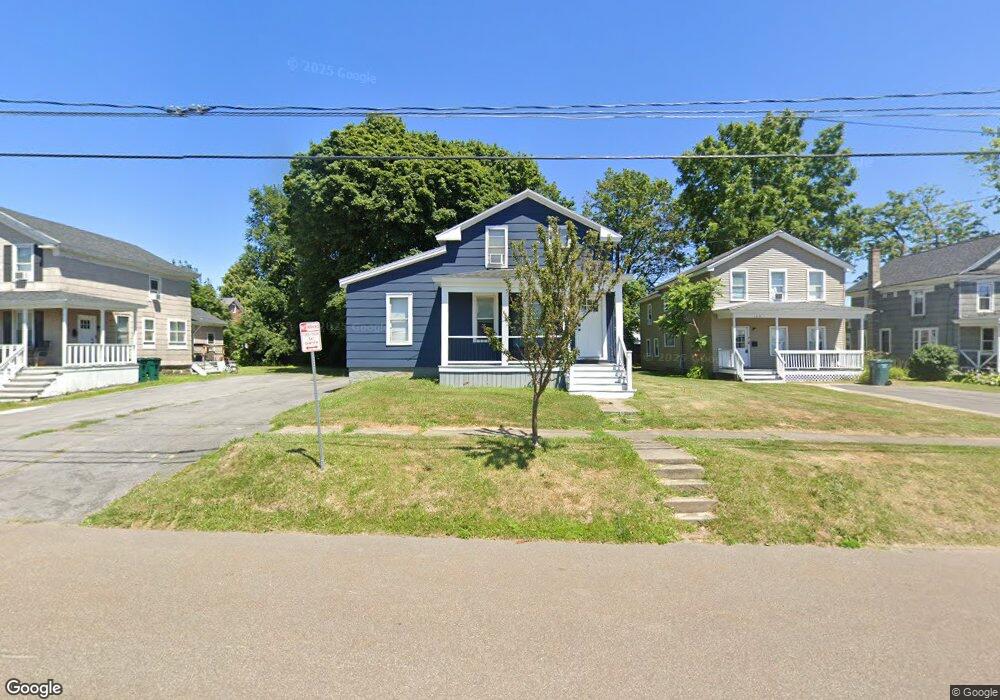
185 W 3rd St Oswego, NY 13126
Estimated Value: $147,100 - $168,000
5
Beds
1
Bath
1,483
Sq Ft
$107/Sq Ft
Est. Value
About This Home
This home is located at 185 W 3rd St, Oswego, NY 13126 and is currently estimated at $158,275, approximately $106 per square foot. 185 W 3rd St is a home located in Oswego County with nearby schools including Leighton Elementary School, Oswego Middle School, and Oswego High School.
Ownership History
Date
Name
Owned For
Owner Type
Purchase Details
Closed on
Jun 28, 2021
Sold by
Bateman Craig R
Bought by
Lcb Enterprises Of Cny Inc
Current Estimated Value
Purchase Details
Closed on
Dec 28, 2012
Sold by
Bateman Richard
Bought by
Bateman Craig
Purchase Details
Closed on
Sep 21, 2012
Sold by
Bateman Richard J and Bateman Penny S
Bought by
Bateman Craig R
Home Financials for this Owner
Home Financials are based on the most recent Mortgage that was taken out on this home.
Original Mortgage
$47,250
Interest Rate
2.68%
Mortgage Type
New Conventional
Create a Home Valuation Report for This Property
The Home Valuation Report is an in-depth analysis detailing your home's value as well as a comparison with similar homes in the area
Home Values in the Area
Average Home Value in this Area
Purchase History
| Date | Buyer | Sale Price | Title Company |
|---|---|---|---|
| Lcb Enterprises Of Cny Inc | -- | Cny Abstract & Ttl Svcs Inc | |
| Bateman Craig | $64,000 | Kimberly Steele | |
| Bateman Craig R | $63,000 | Chicago Title Insurance Co | |
| Bateman Craig R | $64,000 | Chicago Title Insurance Co |
Source: Public Records
Mortgage History
| Date | Status | Borrower | Loan Amount |
|---|---|---|---|
| Previous Owner | Bateman Craig R | $47,250 | |
| Previous Owner | Bateman Craig R | $48,000 |
Source: Public Records
Tax History Compared to Growth
Tax History
| Year | Tax Paid | Tax Assessment Tax Assessment Total Assessment is a certain percentage of the fair market value that is determined by local assessors to be the total taxable value of land and additions on the property. | Land | Improvement |
|---|---|---|---|---|
| 2024 | $1,562 | $121,000 | $24,100 | $96,900 |
| 2023 | $1,172 | $45,000 | $10,900 | $34,100 |
| 2022 | $1,188 | $45,000 | $10,900 | $34,100 |
| 2021 | $1,208 | $45,000 | $10,900 | $34,100 |
| 2020 | $854 | $45,000 | $10,900 | $34,100 |
| 2019 | $1,400 | $45,000 | $10,900 | $34,100 |
| 2018 | $1,400 | $45,000 | $10,900 | $34,100 |
| 2017 | $1,396 | $45,000 | $10,900 | $34,100 |
| 2016 | $432 | $45,000 | $10,900 | $34,100 |
| 2015 | -- | $45,000 | $10,900 | $34,100 |
| 2014 | -- | $45,000 | $10,900 | $34,100 |
Source: Public Records
Map
Nearby Homes