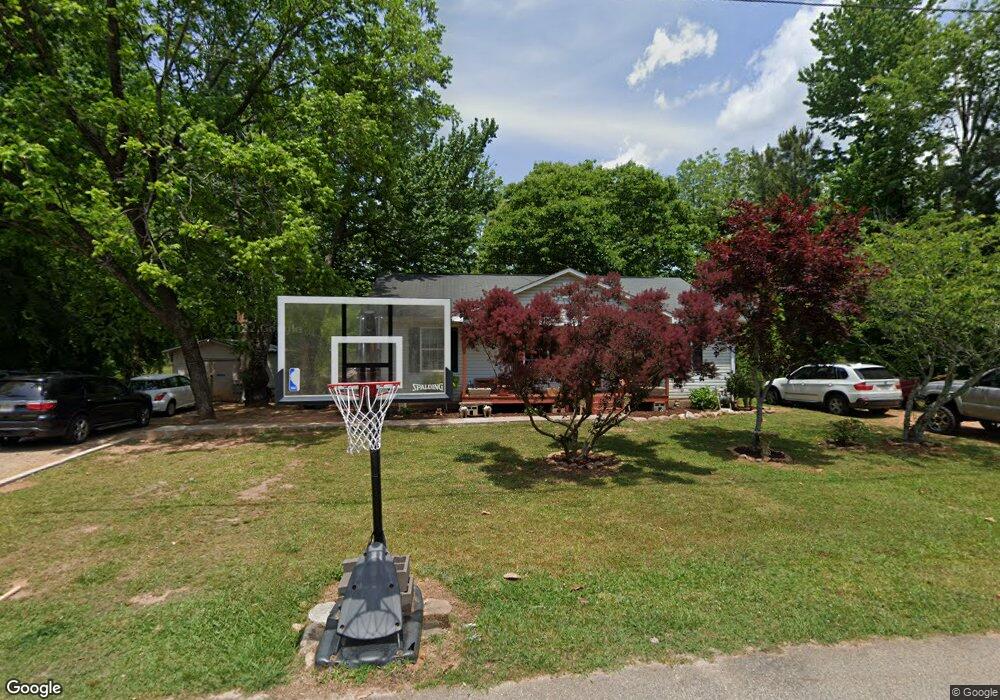
185 Walnut St Cornelia, GA 30531
Estimated Value: $227,000 - $305,000
4
Beds
2
Baths
1,419
Sq Ft
$195/Sq Ft
Est. Value
About This Home
This home is located at 185 Walnut St, Cornelia, GA 30531 and is currently estimated at $276,156, approximately $194 per square foot. 185 Walnut St is a home located in Habersham County with nearby schools including Cornelia Elementary School, Wilbanks Middle School, and Habersham Success Academy.
Ownership History
Date
Name
Owned For
Owner Type
Purchase Details
Closed on
Nov 1, 2007
Sold by
Not Provided
Bought by
Calvillo Guadalupe
Current Estimated Value
Home Financials for this Owner
Home Financials are based on the most recent Mortgage that was taken out on this home.
Original Mortgage
$82,300
Outstanding Balance
$52,018
Interest Rate
6.36%
Mortgage Type
New Conventional
Estimated Equity
$224,138
Purchase Details
Closed on
Mar 9, 2005
Sold by
S & S Appraisal Svc Inc
Bought by
Babbitt Properties Llc
Home Financials for this Owner
Home Financials are based on the most recent Mortgage that was taken out on this home.
Original Mortgage
$71,303
Interest Rate
5.54%
Mortgage Type
New Conventional
Purchase Details
Closed on
Nov 16, 2004
Sold by
Goss Joe C
Bought by
S & S Appraisal Svcs Inc
Purchase Details
Closed on
Nov 10, 2004
Sold by
Hunnicutt William H
Bought by
Goss Joe C
Create a Home Valuation Report for This Property
The Home Valuation Report is an in-depth analysis detailing your home's value as well as a comparison with similar homes in the area
Home Values in the Area
Average Home Value in this Area
Purchase History
| Date | Buyer | Sale Price | Title Company |
|---|---|---|---|
| Calvillo Guadalupe | $82,300 | -- | |
| Babbitt Properties Llc | $66,000 | -- | |
| S & S Appraisal Svcs Inc | $141,300 | -- | |
| Goss Joe C | $69,000 | -- |
Source: Public Records
Mortgage History
| Date | Status | Borrower | Loan Amount |
|---|---|---|---|
| Open | Calvillo Guadalupe | $82,300 | |
| Previous Owner | Babbitt Properties Llc | $71,303 |
Source: Public Records
Tax History
| Year | Tax Paid | Tax Assessment Tax Assessment Total Assessment is a certain percentage of the fair market value that is determined by local assessors to be the total taxable value of land and additions on the property. | Land | Improvement |
|---|---|---|---|---|
| 2025 | $1,736 | $122,083 | $21,300 | $100,783 |
| 2024 | -- | $100,316 | $12,780 | $87,536 |
| 2023 | $930 | $84,928 | $12,780 | $72,148 |
| 2022 | $1,283 | $71,800 | $10,224 | $61,576 |
| 2021 | $1,204 | $63,208 | $8,520 | $54,688 |
| 2020 | $1,147 | $55,348 | $8,520 | $46,828 |
| 2019 | $1,149 | $55,348 | $8,520 | $46,828 |
| 2018 | $1,146 | $55,348 | $8,520 | $46,828 |
| 2017 | $1,051 | $47,976 | $5,680 | $42,296 |
| 2016 | $1,199 | $119,940 | $5,680 | $42,296 |
| 2015 | $1,185 | $119,940 | $5,680 | $42,296 |
| 2014 | $1,169 | $116,320 | $5,680 | $40,848 |
| 2013 | -- | $46,528 | $5,680 | $40,848 |
Source: Public Records
Map
Nearby Homes
- 592 N Main St
- 114 Sugar Creek Dr
- 952 Hoyt St NW
- 240 Sugar Maple Dr
- 204 Sugar Maple Dr
- 795 Wayside St
- 0 Furniture Dr Unit 7545752
- 0 Furniture Dr Unit 10484163
- 1046 Chase Rd
- 1576 Chase Rd
- 1616 Lawrence St
- 16.8AC Camp Creek Rd
- 115 Wood St
- 142 Galloway St
- 2778 J Warren Rd
- 112 Galloway St
- 109 Grove Park Dr
- 221 Mcallister Rd
- 0 Irvin St
- 0 Chase Rd Unit 10658099
Your Personal Tour Guide
Ask me questions while you tour the home.