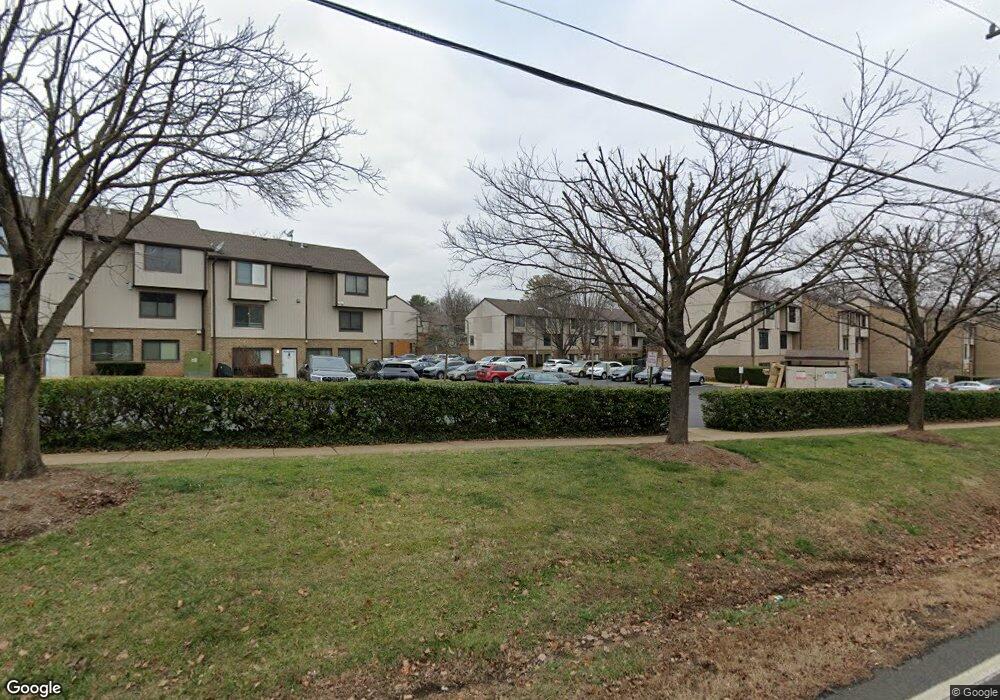
1851 Westwind Way McLean, VA 22102
Tysons Corner NeighborhoodEstimated Value: $465,000 - $514,000
3
Beds
1
Bath
1,138
Sq Ft
$426/Sq Ft
Est. Value
About This Home
This home is located at 1851 Westwind Way, McLean, VA 22102 and is currently estimated at $484,682, approximately $425 per square foot. 1851 Westwind Way is a home located in Fairfax County with nearby schools including Westgate Elementary School, Longfellow Middle School, and McLean High School.
Ownership History
Date
Name
Owned For
Owner Type
Purchase Details
Closed on
Aug 21, 2023
Sold by
Sas Peggy A
Bought by
Ericson Jonathan and Ericson Jobelle
Current Estimated Value
Home Financials for this Owner
Home Financials are based on the most recent Mortgage that was taken out on this home.
Original Mortgage
$380,000
Outstanding Balance
$370,217
Interest Rate
6.81%
Mortgage Type
New Conventional
Estimated Equity
$114,465
Purchase Details
Closed on
Mar 9, 2007
Sold by
Schenk Peter P
Bought by
Sas Brinna S
Home Financials for this Owner
Home Financials are based on the most recent Mortgage that was taken out on this home.
Original Mortgage
$267,750
Interest Rate
6.3%
Mortgage Type
Purchase Money Mortgage
Purchase Details
Closed on
Jan 25, 1999
Sold by
Chiruvolu Arun K
Bought by
Schlenk Peter P
Home Financials for this Owner
Home Financials are based on the most recent Mortgage that was taken out on this home.
Original Mortgage
$84,000
Interest Rate
6.7%
Mortgage Type
Purchase Money Mortgage
Create a Home Valuation Report for This Property
The Home Valuation Report is an in-depth analysis detailing your home's value as well as a comparison with similar homes in the area
Home Values in the Area
Average Home Value in this Area
Purchase History
| Date | Buyer | Sale Price | Title Company |
|---|---|---|---|
| Ericson Jonathan | $475,000 | Chicago Title | |
| Sas Brinna S | $357,000 | -- | |
| Schlenk Peter P | $105,000 | -- |
Source: Public Records
Mortgage History
| Date | Status | Borrower | Loan Amount |
|---|---|---|---|
| Open | Ericson Jonathan | $380,000 | |
| Previous Owner | Sas Brinna S | $267,750 | |
| Previous Owner | Schlenk Peter P | $84,000 |
Source: Public Records
Tax History
| Year | Tax Paid | Tax Assessment Tax Assessment Total Assessment is a certain percentage of the fair market value that is determined by local assessors to be the total taxable value of land and additions on the property. | Land | Improvement |
|---|---|---|---|---|
| 2025 | $5,180 | $475,780 | $95,000 | $380,780 |
| 2024 | $5,180 | $428,630 | $86,000 | $342,630 |
| 2023 | $4,717 | $400,220 | $80,000 | $320,220 |
| 2022 | $4,777 | $400,220 | $80,000 | $320,220 |
| 2021 | $4,754 | $388,560 | $78,000 | $310,560 |
| 2020 | $4,397 | $356,480 | $71,000 | $285,480 |
| 2019 | $4,269 | $346,100 | $69,000 | $277,100 |
| 2018 | $3,794 | $329,900 | $66,000 | $263,900 |
| 2017 | $3,995 | $329,900 | $66,000 | $263,900 |
| 2016 | $3,912 | $323,730 | $65,000 | $258,730 |
Source: Public Records
Map
Nearby Homes
- 1808 Westwind Way Unit 79
- 1669 Westwind Way Unit 174
- 1629 Seneca Ave
- 1747 Gilson St
- 7509 Sawyer Farm Way Unit 2002
- 1628 Great Falls St
- 7552 Sawyer Farm Way Unit 1405
- 1631 Colonial Hills Dr
- 7459 Backett Wood Terrace
- 7461 Backett Wood Terrace Unit 1213
- 7205 Bayside Ct
- 1815 Peabody Dr
- 7416 Sportsman Dr
- 7505 Magarity Rd
- 7405 Storm Ct
- 1726 Baldwin Dr
- 7400 Sportsman Dr
- 7416 Hallcrest Dr
- 7306 Sportsman Dr
- 7103 Westbury Rd
- 1851 Westwind Way Unit 77C
- 1849 Westwind Way
- 1847 Westwind Way
- 1839 Westwind Way
- 1837 Westwind Way Unit 1837
- 1837 Westwind Way Unit 72
- 1835 Westwind Way Unit 70
- 1835 Westwind Way
- 1835 Westwind Way Unit 1835
- 1845 Westwind Way
- 1843 Westwind Way
- 1841 Westwind Way
- 1803 Westwind Way
- 1799 Westwind Way
- 1833 Westwind Way
- 1823 Westwind Way Unit 1823
- 1829 Westwind Way Unit 67
- 1829 Westwind Way
- 1827 Westwind Way Unit 1827
- 1825 Westwind Way Unit 66
Your Personal Tour Guide
Ask me questions while you tour the home.