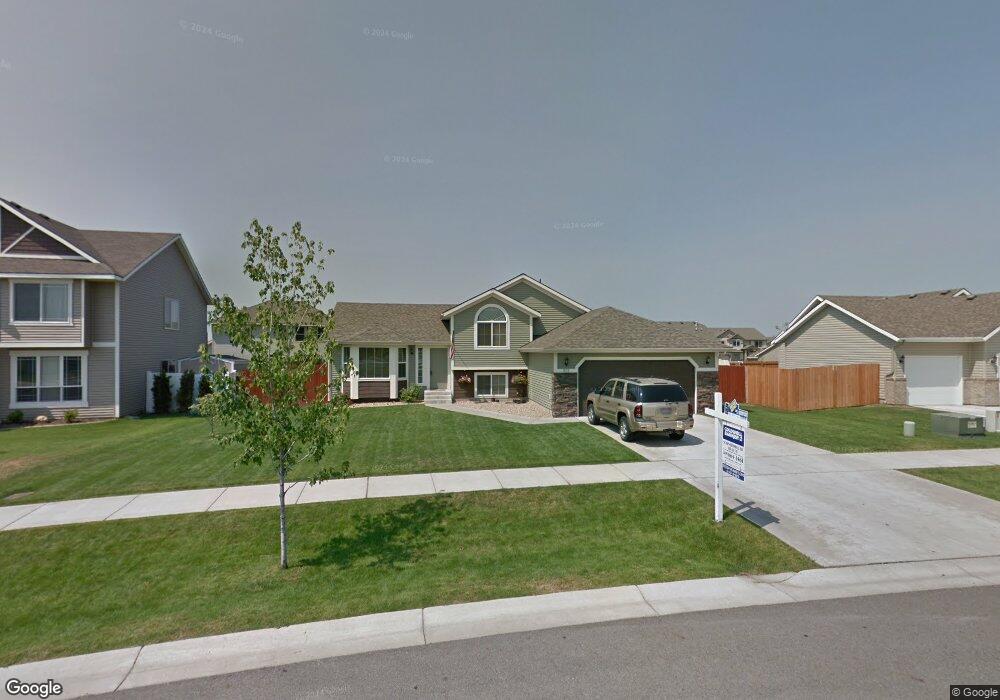
1852 E Dipper Loop Post Falls, ID 83854
North Prairie NeighborhoodEstimated Value: $504,828 - $539,000
4
Beds
3
Baths
1,836
Sq Ft
$284/Sq Ft
Est. Value
About This Home
This home is located at 1852 E Dipper Loop, Post Falls, ID 83854 and is currently estimated at $521,707, approximately $284 per square foot. 1852 E Dipper Loop is a home located in Kootenai County with nearby schools including Prairie View Elementary School, Post Falls Middle School, and Post Falls High School.
Ownership History
Date
Name
Owned For
Owner Type
Purchase Details
Closed on
Sep 27, 2022
Sold by
Bourassa Christopher and Bourassa Samantha
Bought by
Etter Erik and Etter Kendra
Current Estimated Value
Home Financials for this Owner
Home Financials are based on the most recent Mortgage that was taken out on this home.
Original Mortgage
$492,494
Outstanding Balance
$470,064
Interest Rate
5.13%
Mortgage Type
VA
Estimated Equity
$51,643
Purchase Details
Closed on
Aug 19, 2013
Sold by
Mckinley Nathan R and Mckinley Savannah K
Bought by
Bourassa Christopher and Bourassa Samantha
Home Financials for this Owner
Home Financials are based on the most recent Mortgage that was taken out on this home.
Original Mortgage
$206,122
Interest Rate
4.28%
Mortgage Type
New Conventional
Purchase Details
Closed on
Mar 26, 2010
Sold by
Viking Construction Inc
Bought by
Mckinley Nathan R and Mckinley Savannah K
Home Financials for this Owner
Home Financials are based on the most recent Mortgage that was taken out on this home.
Original Mortgage
$171,950
Interest Rate
5.5%
Mortgage Type
FHA
Create a Home Valuation Report for This Property
The Home Valuation Report is an in-depth analysis detailing your home's value as well as a comparison with similar homes in the area
Home Values in the Area
Average Home Value in this Area
Purchase History
| Date | Buyer | Sale Price | Title Company |
|---|---|---|---|
| Etter Erik | -- | Nextitle | |
| Bourassa Christopher | -- | Alliance Title | |
| Mckinley Nathan R | -- | -- |
Source: Public Records
Mortgage History
| Date | Status | Borrower | Loan Amount |
|---|---|---|---|
| Open | Etter Erik | $492,494 | |
| Previous Owner | Bourassa Christopher | $206,122 | |
| Previous Owner | Mckinley Nathan R | $171,950 |
Source: Public Records
Tax History
| Year | Tax Paid | Tax Assessment Tax Assessment Total Assessment is a certain percentage of the fair market value that is determined by local assessors to be the total taxable value of land and additions on the property. | Land | Improvement |
|---|---|---|---|---|
| 2025 | $1,888 | $475,280 | $175,000 | $300,280 |
| 2024 | $2,085 | $453,840 | $152,000 | $301,840 |
| 2023 | $2,842 | $485,987 | $160,000 | $325,987 |
| 2022 | $2,472 | $524,796 | $157,500 | $367,296 |
| 2021 | $2,115 | $332,100 | $105,000 | $227,100 |
| 2020 | $2,202 | $291,350 | $90,000 | $201,350 |
| 2019 | $2,294 | $280,320 | $90,000 | $190,320 |
| 2018 | $2,017 | $243,000 | $70,000 | $173,000 |
| 2017 | $1,832 | $218,520 | $50,000 | $168,520 |
| 2016 | $1,709 | $199,060 | $40,000 | $159,060 |
| 2015 | $1,668 | $189,650 | $37,000 | $152,650 |
| 2013 | $1,427 | $156,998 | $32,000 | $124,998 |
Source: Public Records
Map
Nearby Homes
- 2653 E Thrush
- 1988 E Dipper Loop
- 1462 E Allenby Ave
- 3154 E Thrush
- 3648 White Sands Ln
- 1412 E Allenby Ave
- 3294 N Segar Loop
- 3310 N Segar Loop
- 3265 N Segar Loop
- 3283 N Segar Loop
- 3328 N Segar Loop
- 3321 N Segar Loop
- 2435 N Bunchgrass Dr
- 4350 E Bogie Dr
- 4184 E Bogie Dr
- 4226 E Bogie Dr
- 4398 E Bogie Dr
- 4314 E Bogie Dr
- 4264 E Bogie Dr
- 4440 E Bogie Dr
- 1852 Dipper Loop
- 1870 E Dipper Loop
- 1870 Dipper Loop
- 1824 E Dipper Loop
- 1870 E Dipper Loop
- 2653 Thrush Dr
- 2669 Thrush Dr
- 2669 E Thrush
- 2637 Thrush Dr
- 2637 E Thrush
- L6, B2 Bunting Ln
- 1794 Dipper Loop
- 2685 Thrush Dr
- 2685 E Thrush
- 1794 E Dipper Loop
- 2621 E Thrush
- 1855 Dipper Loop
- 2621 Thrush Dr
- 1855 E Dipper Loop
- 1878 E Dipper Loop
Your Personal Tour Guide
Ask me questions while you tour the home.