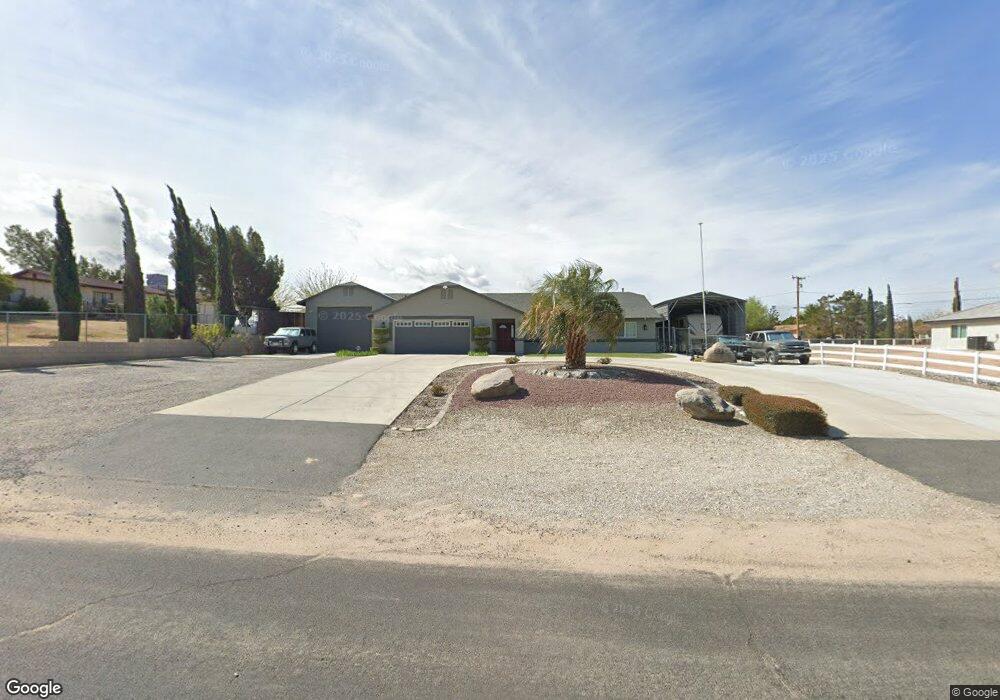
18535 Live Oak St Hesperia, CA 92345
Estimated Value: $429,340 - $510,000
3
Beds
2
Baths
1,740
Sq Ft
$264/Sq Ft
Est. Value
About This Home
This home is located at 18535 Live Oak St, Hesperia, CA 92345 and is currently estimated at $458,835, approximately $263 per square foot. 18535 Live Oak St is a home located in San Bernardino County with nearby schools including Carmel Elementary School, Ranchero Middle School, and Sultana High School.
Ownership History
Date
Name
Owned For
Owner Type
Purchase Details
Closed on
Jun 16, 2023
Sold by
Jones Nicholas A and Jones Nicholas A
Bought by
Jones Family Trust
Current Estimated Value
Purchase Details
Closed on
Nov 10, 2002
Sold by
Meyer Timothy S
Bought by
Jones Nicholas A and Jones Shelly A
Home Financials for this Owner
Home Financials are based on the most recent Mortgage that was taken out on this home.
Original Mortgage
$104,500
Interest Rate
6.28%
Purchase Details
Closed on
May 24, 2002
Sold by
Helmand Robert B
Bought by
Meyer Timothy S and Meyer Lilli A
Create a Home Valuation Report for This Property
The Home Valuation Report is an in-depth analysis detailing your home's value as well as a comparison with similar homes in the area
Purchase History
| Date | Buyer | Sale Price | Title Company |
|---|---|---|---|
| Jones Family Trust | -- | None Listed On Document | |
| Jones Nicholas A | $110,000 | Chicago Title Co | |
| Meyer Timothy S | $13,000 | -- |
Source: Public Records
Mortgage History
| Date | Status | Borrower | Loan Amount |
|---|---|---|---|
| Previous Owner | Jones Nicholas A | $104,500 |
Source: Public Records
Tax History
| Year | Tax Paid | Tax Assessment Tax Assessment Total Assessment is a certain percentage of the fair market value that is determined by local assessors to be the total taxable value of land and additions on the property. | Land | Improvement |
|---|---|---|---|---|
| 2025 | $2,115 | $195,528 | $18,829 | $176,699 |
| 2024 | $2,066 | $191,694 | $18,460 | $173,234 |
| 2023 | $2,043 | $187,935 | $18,098 | $169,837 |
| 2022 | $1,995 | $184,250 | $17,743 | $166,507 |
| 2021 | $1,957 | $180,637 | $17,395 | $163,242 |
| 2020 | $1,934 | $178,785 | $17,217 | $161,568 |
| 2019 | $1,893 | $175,279 | $16,879 | $158,400 |
| 2018 | $1,856 | $171,842 | $16,548 | $155,294 |
| 2017 | $1,822 | $168,473 | $16,224 | $152,249 |
| 2016 | $1,782 | $165,170 | $15,906 | $149,264 |
| 2015 | $1,759 | $162,689 | $15,667 | $147,022 |
| 2014 | $1,734 | $159,502 | $15,360 | $144,142 |
Source: Public Records
Map
Nearby Homes
- 39914350 49 Jacaranda Ave
- 9321 Sabina Ave
- 9472 Guava Ave
- 18747 Albany Ct
- 18804 Vine St
- 9366 Guava Ave
- 18660 Juniper St
- 9381 Choiceana Ave
- 9341 Buckthorn Ave
- 18548 Main St
- 9290 Buckthorn Ave
- 18950 Live Oak St
- 18994 Vine St
- 18646 Main St
- 0 Willow Ct
- 0 Walnut St Unit SW26012015
- 0 Walnut St Unit HD25200098
- 0 Walnut St Unit HD26035739
- 0 Walnut St Unit PW26024868
- 9164 Quincy Ave
- 18555 Live Oak St
- 18517 Live Oak St
- 18569 Live Oak St
- 18505 Live Oak St
- 18538 Live Oak St
- 9435 Jacaranda Ave
- 18554 Live Oak St
- 9455 Jacaranda Ave
- 18524 Live Oak St
- 9472 Jacaranda Ave
- 9498 Jacaranda Ave
- 9420 Harbin Ave
- 18570 Live Oak St
- 18508 Live Oak St
- 9436 Harbin Ave
- 9421 Jacaranda Ave
- 9450 Jacaranda Ave
- 18492 Live Oak St
- 9406 Harbin Ave
- 18588 Live Oak St
Your Personal Tour Guide
Ask me questions while you tour the home.