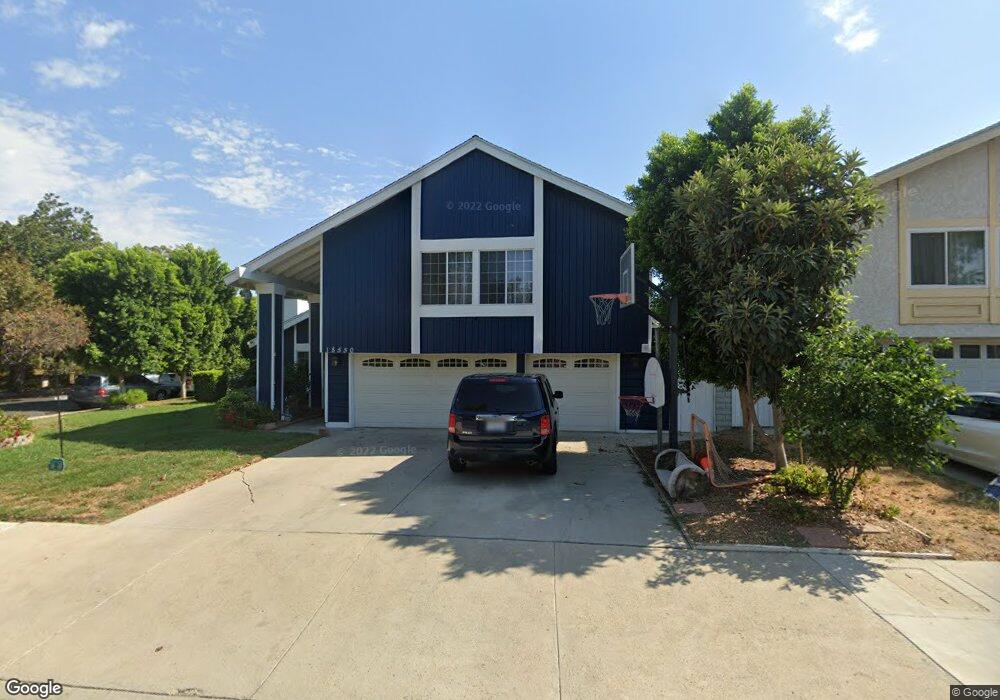
18550 Marilla St Northridge, CA 91324
Estimated Value: $1,122,000 - $1,280,000
4
Beds
3
Baths
2,832
Sq Ft
$423/Sq Ft
Est. Value
About This Home
This home is located at 18550 Marilla St, Northridge, CA 91324 and is currently estimated at $1,196,615, approximately $422 per square foot. 18550 Marilla St is a home located in Los Angeles County with nearby schools including Northridge Academy High, Valley Academy of Arts & Sciences, and Topeka Charter School For Advanced Studies.
Ownership History
Date
Name
Owned For
Owner Type
Purchase Details
Closed on
Aug 8, 2011
Sold by
Lowe Scott E and Lowe Karen E
Bought by
Juarez Oscar and Juarez Evelyn
Current Estimated Value
Home Financials for this Owner
Home Financials are based on the most recent Mortgage that was taken out on this home.
Original Mortgage
$350,000
Outstanding Balance
$240,748
Interest Rate
4.43%
Mortgage Type
New Conventional
Estimated Equity
$955,867
Purchase Details
Closed on
Nov 25, 2003
Sold by
Lowe Scott Eugene and Lowe Karen Elaine
Bought by
Lowe Scott E and Lowe Karen E
Purchase Details
Closed on
Nov 14, 2000
Sold by
Avisrur Ida
Bought by
Lowe Scott Eugene and Lowe Karen Elaine
Home Financials for this Owner
Home Financials are based on the most recent Mortgage that was taken out on this home.
Original Mortgage
$278,000
Interest Rate
7.86%
Purchase Details
Closed on
Apr 15, 1999
Sold by
Avisrur David
Bought by
Avisrur Ida
Create a Home Valuation Report for This Property
The Home Valuation Report is an in-depth analysis detailing your home's value as well as a comparison with similar homes in the area
Home Values in the Area
Average Home Value in this Area
Purchase History
| Date | Buyer | Sale Price | Title Company |
|---|---|---|---|
| Juarez Oscar | $475,000 | Provident Title Company | |
| Lowe Scott E | -- | -- | |
| Lowe Scott Eugene | $309,000 | Chicago Title Co | |
| Avisrur Ida | -- | Continental Title |
Source: Public Records
Mortgage History
| Date | Status | Borrower | Loan Amount |
|---|---|---|---|
| Open | Juarez Oscar | $350,000 | |
| Previous Owner | Lowe Scott Eugene | $278,000 |
Source: Public Records
Tax History Compared to Growth
Tax History
| Year | Tax Paid | Tax Assessment Tax Assessment Total Assessment is a certain percentage of the fair market value that is determined by local assessors to be the total taxable value of land and additions on the property. | Land | Improvement |
|---|---|---|---|---|
| 2025 | $7,486 | $596,615 | $337,243 | $259,372 |
| 2024 | $7,486 | $584,918 | $330,631 | $254,287 |
| 2023 | $7,347 | $573,450 | $324,149 | $249,301 |
| 2022 | $7,014 | $562,207 | $317,794 | $244,413 |
| 2021 | $6,918 | $551,184 | $311,563 | $239,621 |
| 2019 | $6,716 | $534,837 | $302,323 | $232,514 |
| 2018 | $6,611 | $524,351 | $296,396 | $227,955 |
| 2016 | $6,300 | $503,992 | $284,888 | $219,104 |
| 2015 | $6,210 | $496,422 | $280,609 | $215,813 |
| 2014 | $6,236 | $486,699 | $275,113 | $211,586 |
Source: Public Records
Map
Nearby Homes
- 9763 Reseda Blvd Unit 83
- 9625 Yolanda Ave
- 9506 Yolanda Ave
- 9854 Canby Ave
- 18524 Mayall St Unit D
- 18526 Mayall St Unit L
- 10004 Reseda Blvd Unit D
- 18839 Plummer St
- 10116 Viking Ave
- 18753 Mayall St
- 9301 Darby Ave
- 10126 Reseda Blvd Unit 121
- 10126 Reseda Blvd Unit 112
- 18540 Prairie St
- 18645 Knapp St
- 18170 Andrea Cir N Unit 1
- 9251 Wystone Ave
- 18131 Andrea Cir N Unit 4
- 19200 Ballinger St
- 18729 Sunburst St
- 18558 Marilla St
- 9707 Amigo Ave
- 18566 Marilla St
- 9701 Amigo Ave
- 18601 Superior St
- 18574 Marilla St
- 18609 Superior St
- 9655 Amigo Ave
- 9708 Amigo Ave
- 9718 Amigo Ave Unit 99
- 9718 Amigo Ave Unit 100
- 9718 Amigo Ave Unit 101
- 9708 Amigo Ave Unit 102
- 9708 Amigo Ave Unit 103
- 9708 Amigo Ave Unit 104
- 9708 Amigo Ave Unit 105
- 9708 Amigo Ave Unit 106
- 9708 Amigo Ave Unit 107
- 9708 Amigo Ave Unit 108
- 9658 Amigo Ave Unit 109