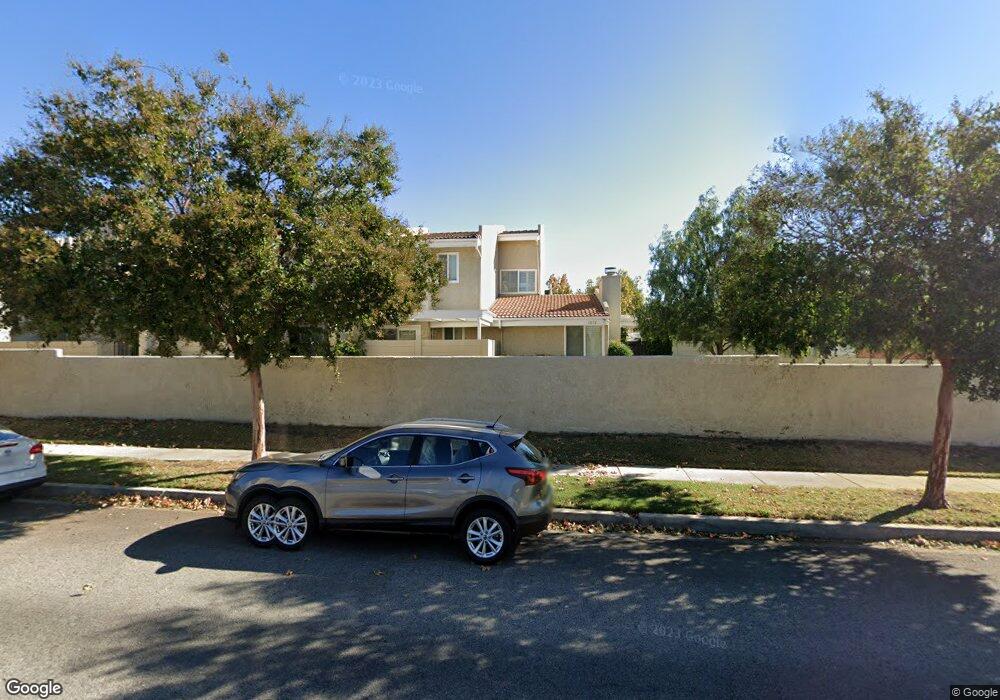
1858 Stow St Simi Valley, CA 93063
East Simi Valley NeighborhoodEstimated Value: $660,000 - $686,837
3
Beds
3
Baths
1,778
Sq Ft
$379/Sq Ft
Est. Value
About This Home
This home is located at 1858 Stow St, Simi Valley, CA 93063 and is currently estimated at $673,709, approximately $378 per square foot. 1858 Stow St is a home located in Ventura County with nearby schools including Katherine Elementary School, Valley View Middle School, and Simi Valley High School.
Ownership History
Date
Name
Owned For
Owner Type
Purchase Details
Closed on
Jan 25, 2007
Sold by
Diruscio Ginger
Bought by
Diruscio Ginger
Current Estimated Value
Purchase Details
Closed on
Mar 18, 1996
Sold by
Jones Bonnie F
Bought by
Diruscio Ginger
Home Financials for this Owner
Home Financials are based on the most recent Mortgage that was taken out on this home.
Original Mortgage
$112,500
Interest Rate
7.68%
Purchase Details
Closed on
Nov 22, 1993
Sold by
Wunderlich Norma M
Bought by
Jones Bonnie F
Home Financials for this Owner
Home Financials are based on the most recent Mortgage that was taken out on this home.
Original Mortgage
$116,000
Interest Rate
6.74%
Purchase Details
Closed on
Sep 10, 1993
Sold by
Wunderlich Norma M and Wunderlich James A
Bought by
Wunderlich Norma M
Create a Home Valuation Report for This Property
The Home Valuation Report is an in-depth analysis detailing your home's value as well as a comparison with similar homes in the area
Home Values in the Area
Average Home Value in this Area
Purchase History
| Date | Buyer | Sale Price | Title Company |
|---|---|---|---|
| Diruscio Ginger | -- | None Available | |
| Diruscio Ginger | $150,000 | Fidelity National Title | |
| Jones Bonnie F | $145,000 | Chicago Title Co | |
| Wunderlich Norma M | -- | Chicago Title Co |
Source: Public Records
Mortgage History
| Date | Status | Borrower | Loan Amount |
|---|---|---|---|
| Previous Owner | Diruscio Ginger | $112,500 | |
| Previous Owner | Jones Bonnie F | $116,000 |
Source: Public Records
Tax History
| Year | Tax Paid | Tax Assessment Tax Assessment Total Assessment is a certain percentage of the fair market value that is determined by local assessors to be the total taxable value of land and additions on the property. | Land | Improvement |
|---|---|---|---|---|
| 2025 | $3,165 | $249,111 | $99,640 | $149,471 |
| 2024 | $3,165 | $244,227 | $97,686 | $146,541 |
| 2023 | $2,974 | $239,439 | $95,771 | $143,668 |
| 2022 | $2,951 | $234,745 | $93,894 | $140,851 |
| 2021 | $2,920 | $230,143 | $92,053 | $138,090 |
| 2020 | $2,853 | $227,785 | $91,110 | $136,675 |
| 2019 | $2,715 | $223,320 | $89,324 | $133,996 |
| 2018 | $2,686 | $218,942 | $87,573 | $131,369 |
| 2017 | $2,621 | $214,650 | $85,856 | $128,794 |
| 2016 | $2,501 | $210,442 | $84,173 | $126,269 |
| 2015 | $2,443 | $207,282 | $82,909 | $124,373 |
| 2014 | $2,419 | $203,224 | $81,286 | $121,938 |
Source: Public Records
Map
Nearby Homes
- 5604 Bloomfield St
- 5657 Pansy St
- 5526 E Los Angeles Ave Unit 2
- 5526 E Los Angeles Ave Unit 4
- 5526 E Los Angeles Ave Unit 1
- 5526 E Los Angeles Ave Unit 3
- 2024 Tulip Ave
- 5518 E Los Angeles Ave Unit 2
- 5518 E Los Angeles Ave Unit 1
- 5518 E Los Angeles Ave Unit 3
- 5518 E Los Angeles Ave Unit 4
- 5510 E Los Angeles Ave Unit 1
- 5510 E Los Angeles Ave Unit 2
- 5510 E Los Angeles Ave Unit 4
- 5510 E Los Angeles Ave Unit 3
- 2037 Freesia Ave
- 5502 E Los Angeles Ave Unit 2
- 5502 E Los Angeles Ave Unit 4
- 5502 E Los Angeles Ave Unit 1
- 5502 E Los Angeles Ave Unit 3
Your Personal Tour Guide
Ask me questions while you tour the home.