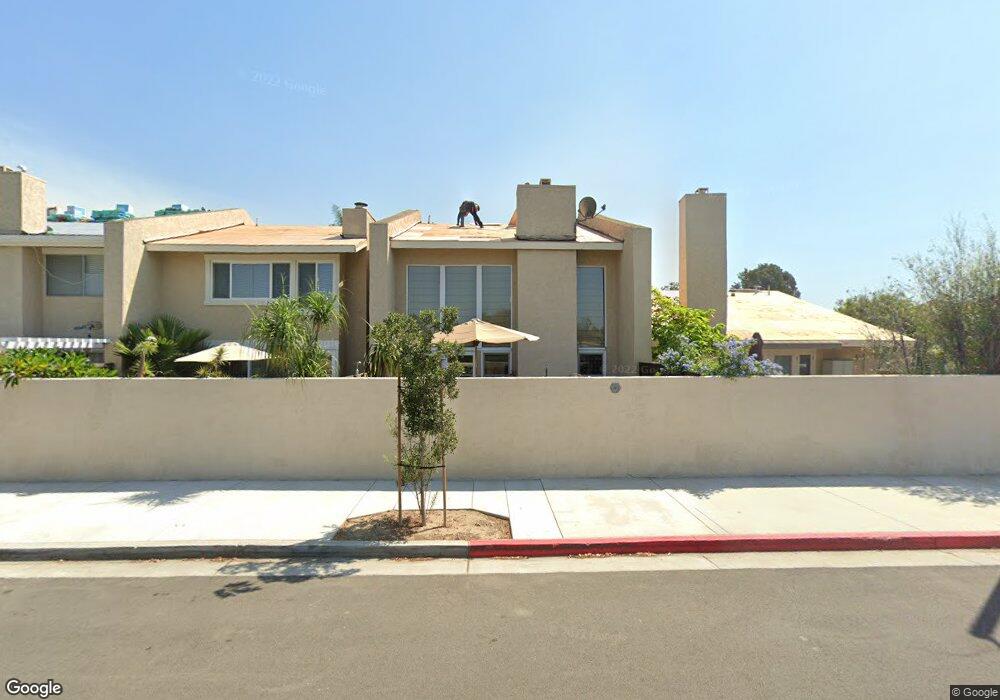
18585 Pueblo Cir Huntington Beach, CA 92646
Estimated Value: $917,850 - $1,035,000
2
Beds
2
Baths
1,337
Sq Ft
$725/Sq Ft
Est. Value
About This Home
This home is located at 18585 Pueblo Cir, Huntington Beach, CA 92646 and is currently estimated at $969,463, approximately $725 per square foot. 18585 Pueblo Cir is a home located in Orange County with nearby schools including Ethel Dwyer Middle, Huntington Beach High School, and Kinetic Academy.
Ownership History
Date
Name
Owned For
Owner Type
Purchase Details
Closed on
May 18, 2004
Sold by
Sanders John R and Sanders Roselyn D
Bought by
Sanders Ii John R and Blundell Sanders Ashley Marie
Current Estimated Value
Home Financials for this Owner
Home Financials are based on the most recent Mortgage that was taken out on this home.
Original Mortgage
$240,000
Interest Rate
6.31%
Mortgage Type
Purchase Money Mortgage
Purchase Details
Closed on
Jul 18, 2002
Sold by
Sanders Roselyn Denise
Bought by
Sanders John R and Sanders Roselyn D
Create a Home Valuation Report for This Property
The Home Valuation Report is an in-depth analysis detailing your home's value as well as a comparison with similar homes in the area
Home Values in the Area
Average Home Value in this Area
Purchase History
| Date | Buyer | Sale Price | Title Company |
|---|---|---|---|
| Sanders Ii John R | $300,000 | First American Title Co | |
| Sanders John R | -- | -- | |
| Sanders Roselyn Denise | -- | -- |
Source: Public Records
Mortgage History
| Date | Status | Borrower | Loan Amount |
|---|---|---|---|
| Closed | Sanders John R | $100,000 | |
| Closed | Sanders John R | $212,000 | |
| Closed | Sanders John R | $150,000 | |
| Closed | Sanders Ii John R | $258,000 | |
| Closed | Sanders Ii John R | $64,500 | |
| Closed | Sanders Ii John R | $265,000 | |
| Closed | Sanders Ii John R | $289,000 | |
| Closed | Sanders Ii John R | $240,000 | |
| Closed | Sanders Ii John R | $45,000 |
Source: Public Records
Tax History Compared to Growth
Tax History
| Year | Tax Paid | Tax Assessment Tax Assessment Total Assessment is a certain percentage of the fair market value that is determined by local assessors to be the total taxable value of land and additions on the property. | Land | Improvement |
|---|---|---|---|---|
| 2025 | $3,848 | $326,835 | $182,865 | $143,970 |
| 2024 | $3,848 | $320,427 | $179,279 | $141,148 |
| 2023 | $3,758 | $314,145 | $175,764 | $138,381 |
| 2022 | $3,657 | $307,986 | $172,318 | $135,668 |
| 2021 | $3,589 | $301,948 | $168,940 | $133,008 |
| 2020 | $3,564 | $298,852 | $167,207 | $131,645 |
| 2019 | $3,523 | $292,993 | $163,929 | $129,064 |
| 2018 | $3,468 | $287,249 | $160,715 | $126,534 |
| 2017 | $3,420 | $281,617 | $157,564 | $124,053 |
| 2016 | $3,274 | $276,096 | $154,475 | $121,621 |
| 2015 | $3,240 | $271,949 | $152,154 | $119,795 |
| 2014 | $3,171 | $266,622 | $149,173 | $117,449 |
Source: Public Records
Map
Nearby Homes
- 18507 Pueblo Cir
- 18555 Vallarta Dr
- 18702 Demion Ln
- 18712 Demion Ln
- 18601 Newland St Unit 59
- 18601 Newland St Unit 97
- 18601 Newland St Unit 12
- 18601 Newland St Unit 71
- 18601 Newland St Unit 38
- 18441 Patterson Ln
- 18785 Heavenwood Cir Unit C171
- 18862 Carolyn Ln
- 18566 Santa Andrea St
- 18101 Wharton Ln
- 8120 Islandview Cir Unit C
- 18021 Gulf Ln
- 7831 Shaffer Cir
- 8803 Hummingbird Ave
- 18911 Florida St
- 7702 Alberta Dr
- 18581 Pueblo Cir
- 18575 Pueblo Cir
- 18571 Pueblo Cir
- 18591 Pueblo Cir
- 18565 Pueblo Cir
- 18555 Pueblo Cir
- 18582 Pueblo Cir
- 18586 Pueblo Cir
- 18592 Pueblo Cir
- 18572 Pueblo Cir
- 18566 Pueblo Cir
- 18551 Pueblo Cir
- 18562 Pueblo Cir
- 18630 Vallarta Dr
- 18632 Vallarta Dr
- 18628 Vallarta Dr
- 18626 Vallarta Dr
- 18545 Pueblo Cir
- 18624 Vallarta Dr
- 18552 Pueblo Cir