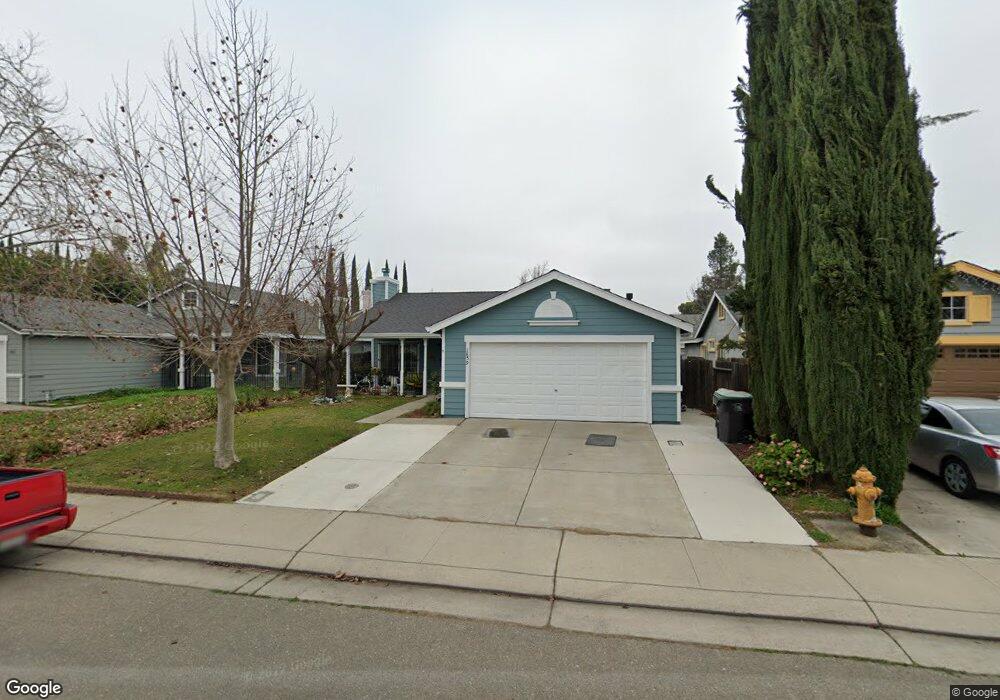
1859 Ridgemark Ln Stockton, CA 95206
Seaport NeighborhoodEstimated Value: $259,000 - $366,000
2
Beds
2
Baths
892
Sq Ft
$363/Sq Ft
Est. Value
About This Home
This home is located at 1859 Ridgemark Ln, Stockton, CA 95206 and is currently estimated at $323,929, approximately $363 per square foot. 1859 Ridgemark Ln is a home located in San Joaquin County with nearby schools including San Joaquin Elementary School, Taylor Leadership Academy, and John Marshall Elementary School.
Ownership History
Date
Name
Owned For
Owner Type
Purchase Details
Closed on
Mar 1, 2016
Sold by
Ridolfi Carolyn Stroud and Ridolfi Carolyn G
Bought by
Ridolfi Carolyn G and The Carolyn G Ridolfi 2016 Rev
Current Estimated Value
Purchase Details
Closed on
Jan 15, 2010
Sold by
Us Bank National Association
Bought by
Ridolfi Carolyn Stroud
Home Financials for this Owner
Home Financials are based on the most recent Mortgage that was taken out on this home.
Original Mortgage
$79,532
Interest Rate
5.37%
Mortgage Type
FHA
Purchase Details
Closed on
Oct 16, 2009
Sold by
Neroza Anacleto B
Bought by
U S Bank National Association
Purchase Details
Closed on
Mar 8, 2006
Sold by
Neroza Anacleto B and Marzan Elena B
Bought by
Neroza Anacleto B
Home Financials for this Owner
Home Financials are based on the most recent Mortgage that was taken out on this home.
Original Mortgage
$220,500
Interest Rate
1%
Mortgage Type
Purchase Money Mortgage
Create a Home Valuation Report for This Property
The Home Valuation Report is an in-depth analysis detailing your home's value as well as a comparison with similar homes in the area
Home Values in the Area
Average Home Value in this Area
Purchase History
| Date | Buyer | Sale Price | Title Company |
|---|---|---|---|
| Ridolfi Carolyn G | -- | None Available | |
| Ridolfi Carolyn Stroud | $75,000 | Lsi Title Company | |
| U S Bank National Association | $54,797 | None Available | |
| Neroza Anacleto B | -- | Chicago Title Co |
Source: Public Records
Mortgage History
| Date | Status | Borrower | Loan Amount |
|---|---|---|---|
| Previous Owner | Ridolfi Carolyn Stroud | $79,532 | |
| Previous Owner | Neroza Anacleto B | $220,500 |
Source: Public Records
Tax History Compared to Growth
Tax History
| Year | Tax Paid | Tax Assessment Tax Assessment Total Assessment is a certain percentage of the fair market value that is determined by local assessors to be the total taxable value of land and additions on the property. | Land | Improvement |
|---|---|---|---|---|
| 2025 | $1,276 | $96,800 | $23,230 | $73,570 |
| 2024 | $1,253 | $94,903 | $22,775 | $72,128 |
| 2023 | $1,224 | $93,043 | $22,329 | $70,714 |
| 2022 | $1,107 | $91,220 | $21,892 | $69,328 |
| 2021 | $1,068 | $89,432 | $21,463 | $67,969 |
| 2020 | $1,087 | $88,516 | $21,243 | $67,273 |
| 2019 | $1,081 | $86,781 | $20,827 | $65,954 |
| 2018 | $1,744 | $85,080 | $20,419 | $64,661 |
| 2017 | $1,540 | $83,413 | $20,019 | $63,394 |
| 2016 | $1,524 | $81,779 | $19,627 | $62,152 |
| 2015 | $1,529 | $80,551 | $19,332 | $61,219 |
| 2014 | $1,451 | $78,974 | $18,954 | $60,020 |
Source: Public Records
Map
Nearby Homes
- 2650 S Fresno Ave
- 2128 Green River Ln
- 1823 Fort Hall Place
- 1409 Laguna Cir
- 1413 Laguna Cir
- 2050 Grey Stone Dr
- 1232 Denver Ave
- 1156 Derrick Dr
- 2242 Port Trinity Cir
- 2079 Gordon Verner Cir
- 2215 Dune Place
- 864 W 5th St
- 2402 Sailboat Ct
- 3745 Wild Rose Ln
- 1890 Gordon Verner Cir
- 2428 Shell Ct
- 3330 Konig Ct
- 1526 Kimiyo St
- 3779 Zeally Ln
- 2625 Crestmore Cir
- 1835 Ridgemark Ln
- 1923 Ridgemark Ln
- 1945 Ridgemark Ln
- 1811 Ridgemark Ln
- 2430 Sea Ranch Ct
- 2422 Sea Ranch Ct
- 1959 Ridgemark Ln
- 2441 S Fresno Ave
- 1860 Ridgemark Ln
- 1803 Ridgemark Ln
- 1924 Ridgemark Ln
- 1832 Ridgemark Ln
- 2423 Sea Ranch Ct
- 2414 Sea Ranch Ct
- 2429 S Fresno Ave
- 1812 Ridgemark Ln
- 1946 Ridgemark Ln
- 1977 Ridgemark Ln
- 1958 Ridgemark Ln
- 1804 Ridgemark Ln