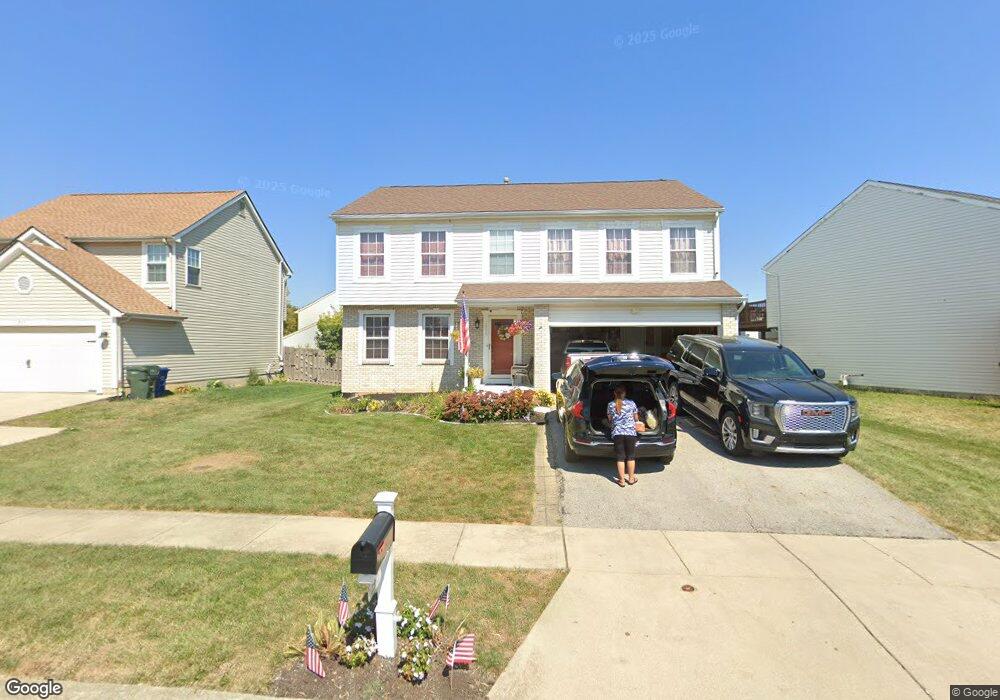
1859 Tobago Dr Galloway, OH 43119
Estimated Value: $334,817 - $385,000
4
Beds
3
Baths
2,134
Sq Ft
$169/Sq Ft
Est. Value
About This Home
This home is located at 1859 Tobago Dr, Galloway, OH 43119 and is currently estimated at $360,204, approximately $168 per square foot. 1859 Tobago Dr is a home located in Franklin County with nearby schools including Bolton Crossing Elementary School, Holt Crossing Intermediate School, and Pleasant View Middle School.
Ownership History
Date
Name
Owned For
Owner Type
Purchase Details
Closed on
Jul 20, 2011
Sold by
Glosenger Jeremiah J and Glosenger Julie Anne
Bought by
Binns Bruce A
Current Estimated Value
Home Financials for this Owner
Home Financials are based on the most recent Mortgage that was taken out on this home.
Original Mortgage
$132,357
Outstanding Balance
$90,211
Interest Rate
4.62%
Mortgage Type
FHA
Estimated Equity
$269,993
Purchase Details
Closed on
May 22, 2007
Sold by
Slagle Terry L and Slagle Russell A
Bought by
Glosenger Jeremiah J
Home Financials for this Owner
Home Financials are based on the most recent Mortgage that was taken out on this home.
Original Mortgage
$156,066
Interest Rate
6.21%
Mortgage Type
FHA
Purchase Details
Closed on
Sep 25, 2002
Sold by
Simpson Robert E
Bought by
Curry Terry L
Purchase Details
Closed on
Oct 26, 2000
Sold by
Maronda Homes Inc Of Ohio
Bought by
Simpson Robert E
Home Financials for this Owner
Home Financials are based on the most recent Mortgage that was taken out on this home.
Original Mortgage
$134,867
Interest Rate
7.9%
Mortgage Type
FHA
Create a Home Valuation Report for This Property
The Home Valuation Report is an in-depth analysis detailing your home's value as well as a comparison with similar homes in the area
Purchase History
| Date | Buyer | Sale Price | Title Company |
|---|---|---|---|
| Binns Bruce A | $135,800 | Fati | |
| Glosenger Jeremiah J | $157,300 | Title Quest | |
| Curry Terry L | -- | -- | |
| Simpson Robert E | $135,000 | Chicago Title Commercial |
Source: Public Records
Mortgage History
| Date | Status | Borrower | Loan Amount |
|---|---|---|---|
| Open | Binns Bruce A | $132,357 | |
| Previous Owner | Glosenger Jeremiah J | $156,066 | |
| Previous Owner | Simpson Robert E | $134,867 |
Source: Public Records
Tax History
| Year | Tax Paid | Tax Assessment Tax Assessment Total Assessment is a certain percentage of the fair market value that is determined by local assessors to be the total taxable value of land and additions on the property. | Land | Improvement |
|---|---|---|---|---|
| 2025 | $3,473 | $95,240 | $25,900 | $69,340 |
| 2024 | $3,473 | $95,240 | $25,900 | $69,340 |
| 2023 | $3,411 | $95,235 | $25,900 | $69,335 |
| 2022 | $3,080 | $63,110 | $13,440 | $49,670 |
| 2021 | $3,142 | $63,110 | $13,440 | $49,670 |
| 2020 | $3,124 | $63,110 | $13,440 | $49,670 |
| 2019 | $2,865 | $51,070 | $11,200 | $39,870 |
| 2018 | $2,895 | $51,070 | $11,200 | $39,870 |
| 2017 | $2,889 | $51,070 | $11,200 | $39,870 |
| 2016 | $2,939 | $48,580 | $7,000 | $41,580 |
| 2015 | $2,939 | $48,580 | $7,000 | $41,580 |
| 2014 | $2,942 | $48,580 | $7,000 | $41,580 |
| 2013 | $1,389 | $46,235 | $6,650 | $39,585 |
Source: Public Records
Map
Nearby Homes
- 5936 Glennon Dr
- 5882 Starcrest Dr
- 5803 Sundrops Ave
- 1871 Galloway Rd
- 6383 Bellmouth Rd
- 6387 Bellmouth Rd
- 1295 Hathersage Place
- 6429 Bellmouth Rd
- 6421 Bellmouth Rd
- 6411 Bellmouth Rd
- 6375 Bellmouth Rd
- 1083 Oak Bay Dr
- 1086 Oak Bay Dr Unit 1086
- 6417 Bellmouth Rd
- 6285 Bausch Rd
- 6180 Greenhaven Ave
- 6435 Bellmouth Rd
- 6059 Chidley St
- 5927 Whitehaven Dr
- 813 Hurlock Ln
- 1843 Tobago Dr
- 1867 Tobago Dr
- 1780 Convair Dr
- 1827 Tobago Dr
- 1811 Tobago Dr
- 1774 Convair Dr
- 1860 Tobago Dr
- 1797 Tobago Dr
- 1852 Tobago Dr
- 1868 Tobago Dr
- 1844 Tobago Dr
- 1768 Convair Dr
- 1781 Tobago Dr
- 1836 Tobago Dr
- 1793 Convair Dr
- 1787 Convair Dr
- 1799 Convair Dr
- 1781 Convair Dr
- 1762 Convair Dr
- 1773 Tobago Dr
Your Personal Tour Guide
Ask me questions while you tour the home.