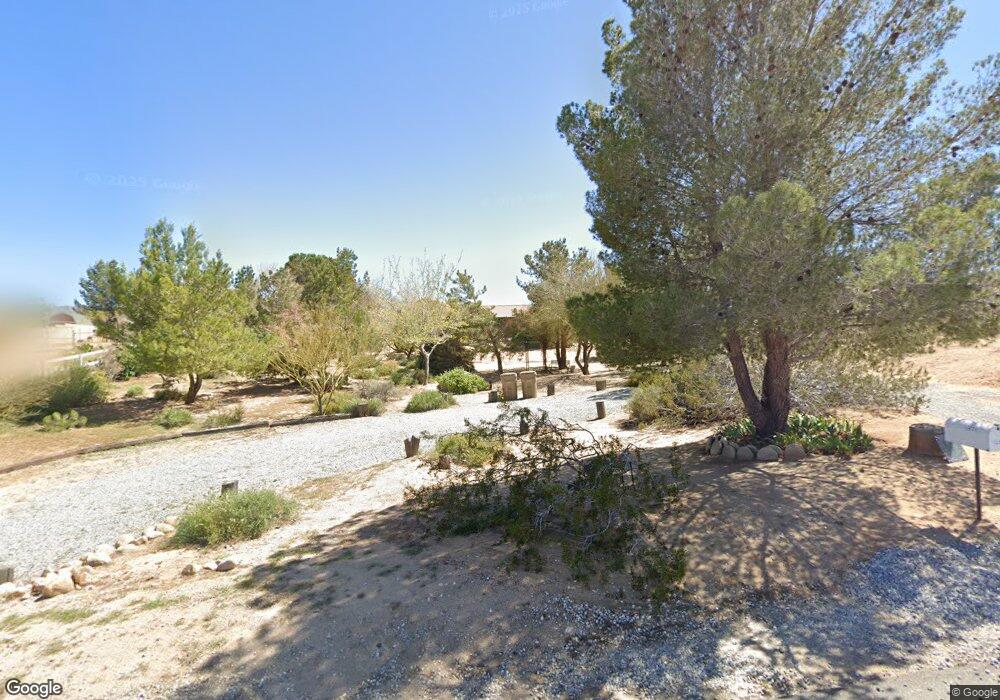
18595 Verano St Hesperia, CA 92345
Estimated Value: $457,801 - $523,000
3
Beds
2
Baths
2,117
Sq Ft
$232/Sq Ft
Est. Value
About This Home
This home is located at 18595 Verano St, Hesperia, CA 92345 and is currently estimated at $490,200, approximately $231 per square foot. 18595 Verano St is a home located in San Bernardino County with nearby schools including Carmel Elementary School, Ranchero Middle School, and Sultana High School.
Ownership History
Date
Name
Owned For
Owner Type
Purchase Details
Closed on
Nov 16, 2006
Sold by
Gillespie Roger A and Gillespie Diane H
Bought by
Gillespie Roger A and Gillespie Diane H
Current Estimated Value
Home Financials for this Owner
Home Financials are based on the most recent Mortgage that was taken out on this home.
Original Mortgage
$129,500
Interest Rate
6.28%
Mortgage Type
New Conventional
Purchase Details
Closed on
Oct 20, 2006
Sold by
Gillespie Roger A and Gillespie Diane H
Bought by
Gillespie Roger A and Gillespie Diane H
Home Financials for this Owner
Home Financials are based on the most recent Mortgage that was taken out on this home.
Original Mortgage
$129,500
Interest Rate
6.28%
Mortgage Type
New Conventional
Purchase Details
Closed on
Sep 8, 2005
Sold by
Gillespie Roger A and Gillespie Diane H
Bought by
Gillespie Roger A and Gillespie Diane H
Create a Home Valuation Report for This Property
The Home Valuation Report is an in-depth analysis detailing your home's value as well as a comparison with similar homes in the area
Home Values in the Area
Average Home Value in this Area
Purchase History
| Date | Buyer | Sale Price | Title Company |
|---|---|---|---|
| Gillespie Roger A | -- | None Available | |
| Gillespie Roger A | -- | Chicago Title Company | |
| Gillespie Roger A | -- | -- |
Source: Public Records
Mortgage History
| Date | Status | Borrower | Loan Amount |
|---|---|---|---|
| Previous Owner | Gillespie Roger A | $129,500 |
Source: Public Records
Tax History Compared to Growth
Tax History
| Year | Tax Paid | Tax Assessment Tax Assessment Total Assessment is a certain percentage of the fair market value that is determined by local assessors to be the total taxable value of land and additions on the property. | Land | Improvement |
|---|---|---|---|---|
| 2025 | $2,178 | $205,119 | $29,007 | $176,112 |
| 2024 | $2,178 | $201,097 | $28,438 | $172,659 |
| 2023 | $2,153 | $197,154 | $27,880 | $169,274 |
| 2022 | $2,103 | $193,288 | $27,333 | $165,955 |
| 2021 | $2,063 | $189,498 | $26,797 | $162,701 |
| 2020 | $2,039 | $187,555 | $26,522 | $161,033 |
| 2019 | $1,995 | $183,877 | $26,002 | $157,875 |
| 2018 | $1,956 | $180,271 | $25,492 | $154,779 |
| 2017 | $1,921 | $176,736 | $24,992 | $151,744 |
| 2016 | $1,879 | $173,271 | $24,502 | $148,769 |
| 2015 | $1,854 | $170,668 | $24,134 | $146,534 |
| 2014 | $1,828 | $167,325 | $23,661 | $143,664 |
Source: Public Records
Map
Nearby Homes
- 18635 Verano St
- 18441 Verano St
- 18476 Talisman St
- 10765 Choiceana Ave
- 18785 Talisman St
- 18333 Talisman St
- 10656 Choiceana Ave
- 18238 Talisman St
- 18135 Valencia St
- 0 Jacaranda Unit CV24240940
- 18014 Talisman St
- 11389 Jacaranda Ave
- 11444 River Run St
- 18707 Hercules St
- 18585 Hercules St
- 0 Choiceana Ave Unit IV25199738
- 0 Choiceana Ave Unit HD25180587
- 11156 Camden St
- 11562 Orchid Ave
- 18125 Hackberry St
- 18615 Verano St
- 18565 Verano St
- 18604 Lemert St
- 18624 Lemert St
- 18592 Verano St
- 18588 Lemert St
- 18616 Verano St
- 18547 Verano St
- 10912 Moreno Ave
- 0 Lemert St
- 18570 Lemert St
- 18640 Verano St
- 18659 Verano St
- 18609 Lemert St
- 10936 Moreno Ave
- 18523 Verano St
- 18520 Verano St
- 18635 Lemert St
- 0 Moreno Ave
- 10941 Orchid Ave