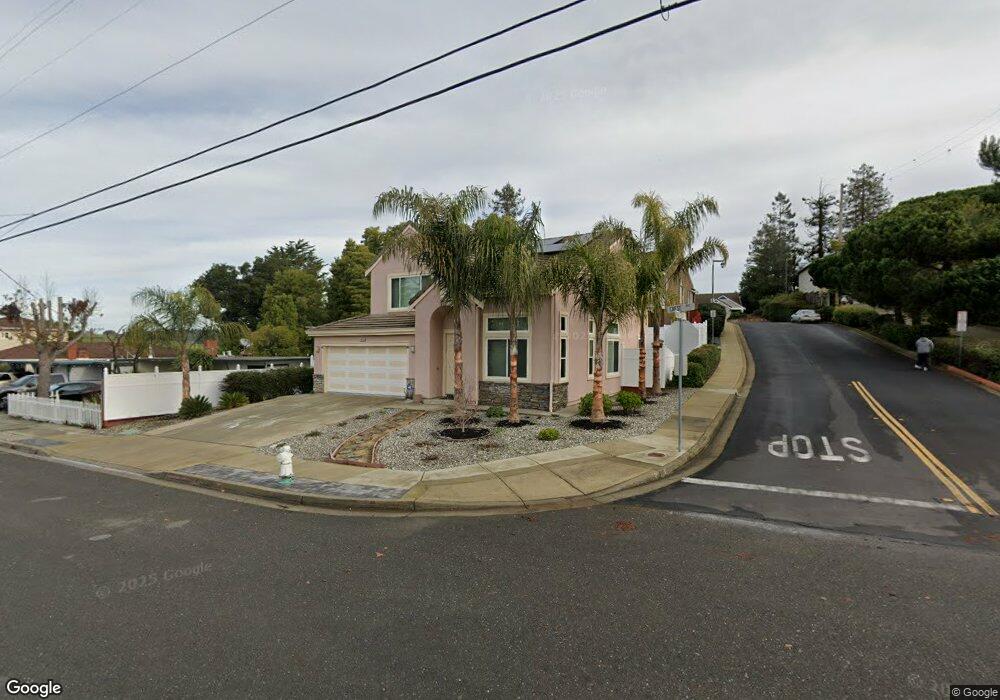
18608 Crest Ave Castro Valley, CA 94546
West Castro Valley NeighborhoodEstimated Value: $1,074,000 - $1,323,000
5
Beds
3
Baths
2,300
Sq Ft
$543/Sq Ft
Est. Value
About This Home
This home is located at 18608 Crest Ave, Castro Valley, CA 94546 and is currently estimated at $1,249,155, approximately $543 per square foot. 18608 Crest Ave is a home located in Alameda County with nearby schools including Stanton Elementary School, Creekside Middle School, and Canyon Middle School.
Ownership History
Date
Name
Owned For
Owner Type
Purchase Details
Closed on
Apr 13, 2001
Sold by
Chauhan Pushpa and Chauhan Vinod J
Bought by
Chauhan Vinod J and Chauhan Pushpa
Current Estimated Value
Home Financials for this Owner
Home Financials are based on the most recent Mortgage that was taken out on this home.
Original Mortgage
$261,000
Outstanding Balance
$95,928
Interest Rate
6.98%
Estimated Equity
$1,153,227
Purchase Details
Closed on
Jul 24, 2000
Sold by
Stanton Place Partners Llc
Bought by
Chauhan Vinod J and Chauhan Pushpa
Home Financials for this Owner
Home Financials are based on the most recent Mortgage that was taken out on this home.
Original Mortgage
$259,900
Interest Rate
8.2%
Purchase Details
Closed on
Feb 5, 1998
Sold by
Riney Bernice
Bought by
Kremer Kenneth A and Hanson & Hanson Builders Inc
Create a Home Valuation Report for This Property
The Home Valuation Report is an in-depth analysis detailing your home's value as well as a comparison with similar homes in the area
Home Values in the Area
Average Home Value in this Area
Purchase History
| Date | Buyer | Sale Price | Title Company |
|---|---|---|---|
| Chauhan Vinod J | -- | Chicago Title | |
| Chauhan Vinod J | $460,000 | Old Republic Title Company | |
| Kremer Kenneth A | $750,000 | Old Republic Title Company |
Source: Public Records
Mortgage History
| Date | Status | Borrower | Loan Amount |
|---|---|---|---|
| Open | Chauhan Vinod J | $261,000 | |
| Closed | Chauhan Vinod J | $259,900 |
Source: Public Records
Tax History
| Year | Tax Paid | Tax Assessment Tax Assessment Total Assessment is a certain percentage of the fair market value that is determined by local assessors to be the total taxable value of land and additions on the property. | Land | Improvement |
|---|---|---|---|---|
| 2025 | $8,735 | $685,944 | $207,928 | $485,016 |
| 2024 | $8,735 | $672,359 | $203,852 | $475,507 |
| 2023 | $8,592 | $666,040 | $199,855 | $466,185 |
| 2022 | $8,424 | $645,983 | $195,937 | $457,046 |
| 2021 | $8,207 | $633,180 | $192,096 | $448,084 |
| 2020 | $8,019 | $633,617 | $190,126 | $443,491 |
| 2019 | $8,165 | $621,195 | $186,399 | $434,796 |
| 2018 | $7,932 | $609,017 | $182,745 | $426,272 |
| 2017 | $7,723 | $597,078 | $179,162 | $417,916 |
| 2016 | $7,347 | $585,373 | $175,650 | $409,723 |
Source: Public Records
Map
Nearby Homes
- 18662 Stanton Ave
- 19100 Crest Ave Unit 100
- 19100 Crest Ave Unit 23
- 19100 Crest Ave Unit 107
- 19100 Crest Ave Unit 15
- 19100 Crest Ave Unit 30
- 15933 Cambrian Dr
- 0 Lindview Dr
- 16306 Ridgehaven Dr Unit 104
- 2500 Miramar Ave Unit 101
- 2500 Miramar Ave Unit 203
- 2812 Sydney Way
- 2545 Fox Ridge Dr
- 16330 Ridgehaven Dr Unit 802
- 2505 Miramar Ave Unit 122
- 16605 Rolando Ave
- 3305 Arcadian Dr
- 1672 162nd Ave
- 19029 Carlton Ave
- 15675 Liberty St
- 18540 Crest Ave
- 2508 Ridge Crest Ct
- 18646 Crest Ave
- 18518 Crest Ave
- 2512 Ridge Crest Ct
- 18609 Crest Ave
- 18650 Crest Ave
- 18575 Crest Ave
- 18652 Crest Ave
- 2520 Ridge Crest Ct
- 18615 Crest Ave
- 18618 Crest Ave
- 18627 Crest Ave
- 18448 Crest Ave
- 18517 Crest Ave
- 2476 Mikemary Ct
- 2526 Ridge Crest Ct
- 2497 Easy St
- 18658 Crest Ave
- 2509 Ridge Crest Ct
Your Personal Tour Guide
Ask me questions while you tour the home.