Estimated Value: $1,330,000 - $1,413,000
5
Beds
3
Baths
2,602
Sq Ft
$528/Sq Ft
Est. Value
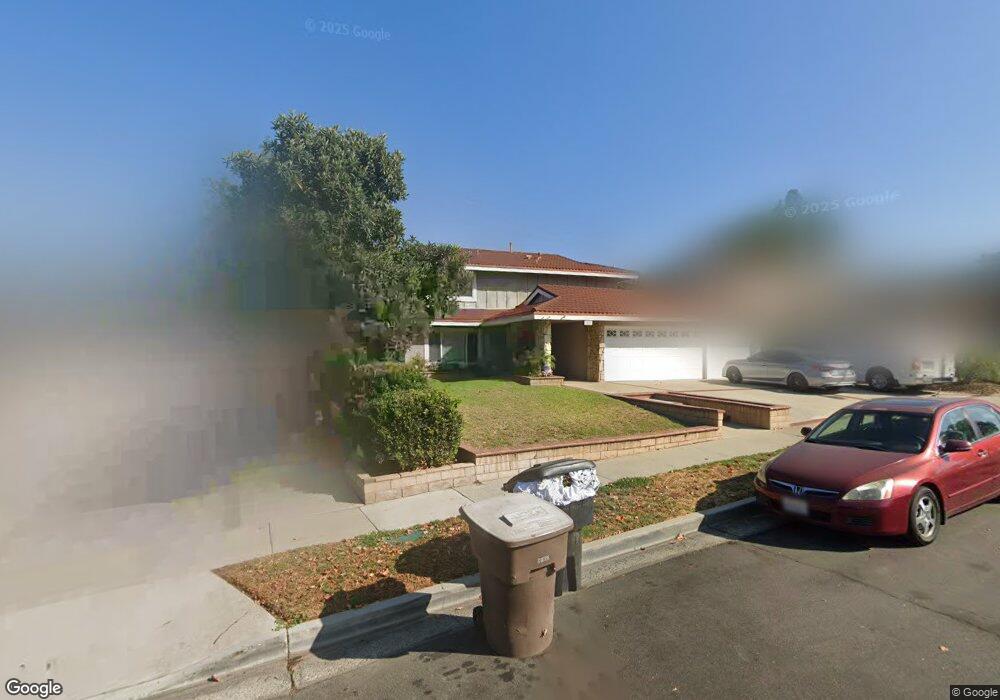
About This Home
This home is located at 1861 Hillhaven Dr, Brea, CA 92821 and is currently estimated at $1,372,760, approximately $527 per square foot. 1861 Hillhaven Dr is a home located in Orange County with nearby schools including Brea Country Hills Elementary School, Brea Junior High School, and Brea-Olinda High School.
Ownership History
Date
Name
Owned For
Owner Type
Purchase Details
Closed on
Jan 11, 2025
Sold by
Debarros Carla Yvette and Debarros Manuel Francis
Bought by
Debarros Revocable Living Trust and Debarros
Current Estimated Value
Purchase Details
Closed on
May 6, 2008
Sold by
Ronquillo Amado and Ronquillo Sylvia
Bought by
Debarros Manuel and Debarros Carla
Home Financials for this Owner
Home Financials are based on the most recent Mortgage that was taken out on this home.
Original Mortgage
$500,000
Interest Rate
6%
Mortgage Type
New Conventional
Purchase Details
Closed on
Dec 30, 1993
Sold by
Hud
Bought by
Ronquillo Amado and Ronquillo Sylvia
Home Financials for this Owner
Home Financials are based on the most recent Mortgage that was taken out on this home.
Original Mortgage
$181,000
Interest Rate
7.16%
Create a Home Valuation Report for This Property
The Home Valuation Report is an in-depth analysis detailing your home's value as well as a comparison with similar homes in the area
Home Values in the Area
Average Home Value in this Area
Purchase History
| Date | Buyer | Sale Price | Title Company |
|---|---|---|---|
| Debarros Revocable Living Trust | -- | None Listed On Document | |
| Debarros Manuel | $625,000 | Fnt | |
| Ronquillo Amado | -- | Investors Title Company |
Source: Public Records
Mortgage History
| Date | Status | Borrower | Loan Amount |
|---|---|---|---|
| Previous Owner | Debarros Manuel | $500,000 | |
| Previous Owner | Ronquillo Amado | $181,000 |
Source: Public Records
Tax History
| Year | Tax Paid | Tax Assessment Tax Assessment Total Assessment is a certain percentage of the fair market value that is determined by local assessors to be the total taxable value of land and additions on the property. | Land | Improvement |
|---|---|---|---|---|
| 2025 | $9,136 | $820,940 | $590,316 | $230,624 |
| 2024 | $9,136 | $804,844 | $578,742 | $226,102 |
| 2023 | $8,885 | $789,063 | $567,394 | $221,669 |
| 2022 | $8,803 | $773,592 | $556,269 | $217,323 |
| 2021 | $8,636 | $758,424 | $545,362 | $213,062 |
| 2020 | $8,579 | $750,648 | $539,770 | $210,878 |
| 2019 | $8,344 | $735,930 | $529,186 | $206,744 |
| 2018 | $8,217 | $721,500 | $518,809 | $202,691 |
| 2017 | $8,061 | $707,353 | $508,636 | $198,717 |
| 2016 | $7,899 | $693,484 | $498,663 | $194,821 |
| 2015 | $7,683 | $672,000 | $496,416 | $175,584 |
| 2014 | $7,179 | $627,571 | $451,987 | $175,584 |
Source: Public Records
Map
Nearby Homes
- 1796 Ravencrest Dr
- 2991 Gingerwood Cir
- 2851 Rolling Hills Dr Unit 257
- 2851 Rolling Hills Dr Unit 248
- 2851 Rolling Hills Dr
- 2304 Carrotwood Dr
- 2050 Fallingleaf Cir
- 3054 Associated Rd Unit 20
- 3062 Associated Rd Unit 1
- 3010 Associated Rd Unit 122
- 3000 Associated Rd Unit 60
- 2313 Lark Ellen Dr
- 2733 Quail Ridge Cir Unit 32
- 3016 Clearwood Ct
- 648 Pepperwood Dr
- 2541 Thorn Place
- 2760 Quail Ridge Cir Unit 57
- 213 Appalachian Cir
- 2363 Morning Dew Dr
- 206 Allegheny Cir
- 1841 Hillhaven Dr
- 1881 Hillhaven Dr
- 1821 Hillhaven Dr
- 371 Hillhaven Cir
- 1860 Hillhaven Dr
- 1882 Hillhaven Dr
- 1840 Hillhaven Dr
- 1801 Hillhaven Dr
- 1820 Hillhaven Dr
- 1896 Hillhaven Dr
- 1800 Hillhaven Dr
- 1913 Westmoreland Dr
- 1906 Hillhaven Dr
- 355 Hillhaven Cir
- 1919 Westmoreland Dr
- 1909 Westmoreland Dr
- 414 Greenbriar Ln
- 370 Hillhaven Cir
- 1929 Westmoreland Dr
- 1926 Hillhaven Dr
Your Personal Tour Guide
Ask me questions while you tour the home.