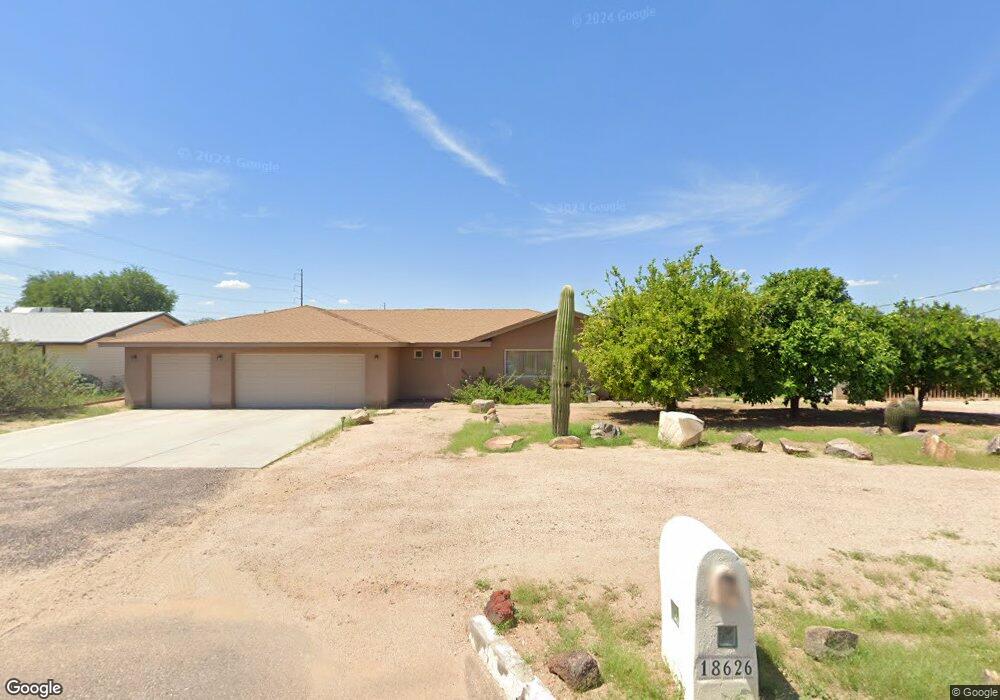
18626 N 30th St Phoenix, AZ 85050
Paradise Valley Village NeighborhoodEstimated Value: $733,000 - $877,000
--
Bed
3
Baths
2,769
Sq Ft
$283/Sq Ft
Est. Value
About This Home
This home is located at 18626 N 30th St, Phoenix, AZ 85050 and is currently estimated at $783,152, approximately $282 per square foot. 18626 N 30th St is a home located in Maricopa County with nearby schools including Sunset Canyon School, Eagle Ridge Elementary School, and Pinnacle High School.
Ownership History
Date
Name
Owned For
Owner Type
Purchase Details
Closed on
Jul 15, 2025
Sold by
Clay Mark A and Cantu Gerri A
Bought by
Clay Cantu Family Trust and Clay
Current Estimated Value
Purchase Details
Closed on
Apr 26, 2013
Sold by
Cantu Gerri A and Clay Mark A
Bought by
Cantu Gerri A and Clay Mark A
Home Financials for this Owner
Home Financials are based on the most recent Mortgage that was taken out on this home.
Original Mortgage
$210,570
Interest Rate
3.51%
Mortgage Type
New Conventional
Purchase Details
Closed on
May 11, 1998
Sold by
Holman Joseph J and Holman Cindy L
Bought by
Cantu Gerri and Clay Mark
Home Financials for this Owner
Home Financials are based on the most recent Mortgage that was taken out on this home.
Original Mortgage
$118,750
Interest Rate
7.07%
Mortgage Type
New Conventional
Purchase Details
Closed on
Apr 7, 1993
Sold by
Blumenthal Ella D
Bought by
Holman Joseph J and Holman Cindy L
Create a Home Valuation Report for This Property
The Home Valuation Report is an in-depth analysis detailing your home's value as well as a comparison with similar homes in the area
Home Values in the Area
Average Home Value in this Area
Purchase History
| Date | Buyer | Sale Price | Title Company |
|---|---|---|---|
| Clay Cantu Family Trust | -- | None Listed On Document | |
| Cantu Gerri A | -- | Chicago Title Agency Inc | |
| Cantu Gerri | $125,000 | Security Title Agency | |
| Holman Joseph J | -- | Fidelity Title |
Source: Public Records
Mortgage History
| Date | Status | Borrower | Loan Amount |
|---|---|---|---|
| Previous Owner | Cantu Gerri A | $210,570 | |
| Previous Owner | Cantu Gerri | $118,750 |
Source: Public Records
Tax History Compared to Growth
Tax History
| Year | Tax Paid | Tax Assessment Tax Assessment Total Assessment is a certain percentage of the fair market value that is determined by local assessors to be the total taxable value of land and additions on the property. | Land | Improvement |
|---|---|---|---|---|
| 2025 | $3,600 | $41,100 | -- | -- |
| 2024 | $3,405 | $39,142 | -- | -- |
| 2023 | $3,405 | $63,750 | $12,750 | $51,000 |
| 2022 | $3,365 | $47,910 | $9,580 | $38,330 |
| 2021 | $3,412 | $44,660 | $8,930 | $35,730 |
| 2020 | $3,296 | $41,150 | $8,230 | $32,920 |
| 2019 | $3,310 | $38,780 | $7,750 | $31,030 |
| 2018 | $3,190 | $36,760 | $7,350 | $29,410 |
| 2017 | $3,046 | $34,730 | $6,940 | $27,790 |
| 2016 | $2,998 | $34,410 | $6,880 | $27,530 |
| 2015 | $2,781 | $28,760 | $5,750 | $23,010 |
Source: Public Records
Map
Nearby Homes
- 2902 E Villa Theresa Dr
- 3005 E Renee Dr Unit 1,2,3,4,5,6
- 2833 E Renee Dr
- 3005 E Siesta Ln
- 18250 N 32nd St Unit 1010
- 2908 E Michelle Dr Unit 7
- 2636 E Union Hills Dr
- 2732 E Villa Rita Dr
- 3228 E Taro Ln
- 3317 E Wescott Dr
- 3114 E Kristal Way
- 3036 E Utopia Rd Unit 12
- 19005 N 33rd Place
- 2731 E Charleston Ave
- 2608 E Villa Rita Dr
- 3013 E Bremen St
- 3230 E Kristal Way
- 18825 N 34th St
- 2530 E Wagoner Rd
- 2532 E Bluefield Ave Unit 2
- 18618 N 30th St
- 18621 N 29th Place
- 18636 N 30th St
- 3001 E Rockwood Dr
- 2992 E Union Hills Dr
- 2940 E Union Hills Dr
- 3007 E Rockwood Dr
- 18610 N 30th St
- 3005 E Renee 1 2 3 4 5 6 Dr Unit 6
- 18648 N 30th St
- 3011 E Rockwood Dr Unit <--WOW
- 3011 E Rockwood Dr
- 18739 N 30th St
- 3015 E Rockwood Dr
- 0000 E Ooo Dr
- 3019 E Rockwood Dr
- 18808 N 30th St
- 18626 N 29th Place
- 18801 N 29th Place
- 3012 E Rockwood Dr