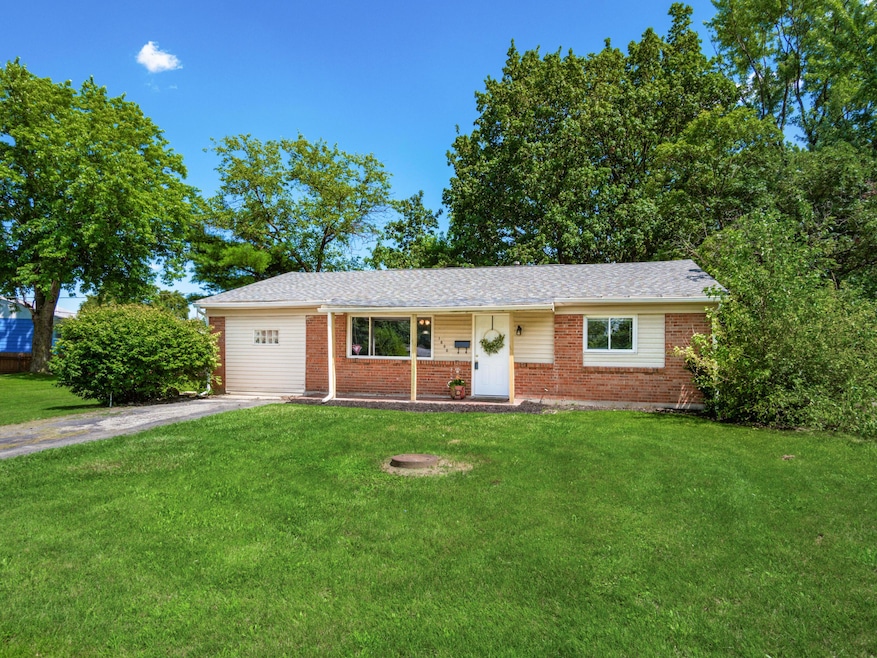
1866 Queensrowe Ct Columbus, OH 43227
Linwood NeighborhoodEstimated payment $1,174/month
Highlights
- Ranch Style House
- Great Room
- Cul-De-Sac
- Bonus Room
- No HOA
- Ceramic Tile Flooring
About This Home
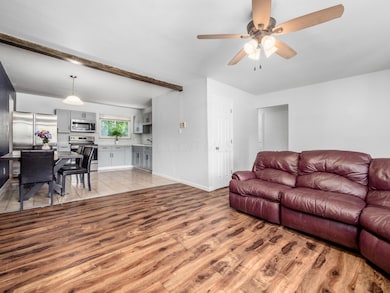
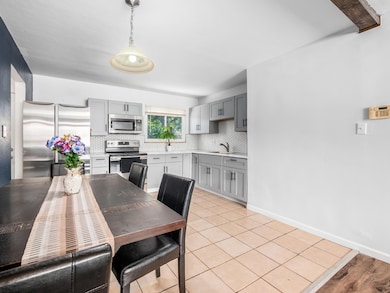
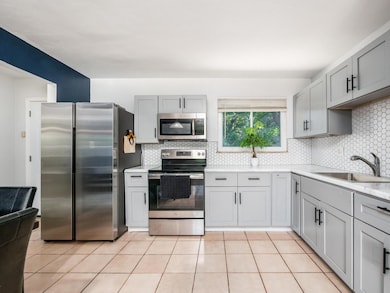
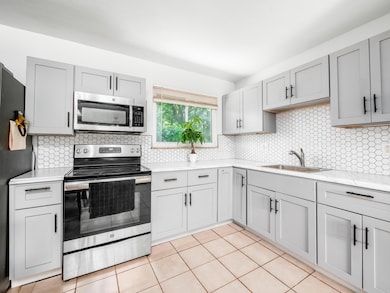
Price Improvement-Motivated Seller! Tucked away on a quiet cul-de-sac in the Berwyn community; this 3-bed, 1-bath ranch offers comfort and convenience. The home features an updated kitchen boosting modern cabinetry, new countertops, SS appliances, along with a freshly painted interior that gives the space a clean, inviting move-in feel.
Enjoy the refreshed full bath and front porch facelift. Additional updates include all new interior and exterior doors, newer A/C and a newer roof for added peace of mind.
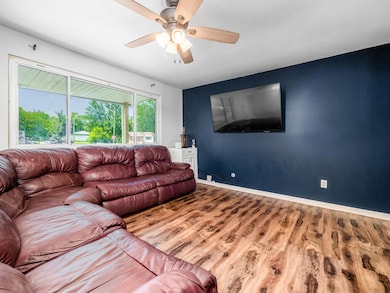
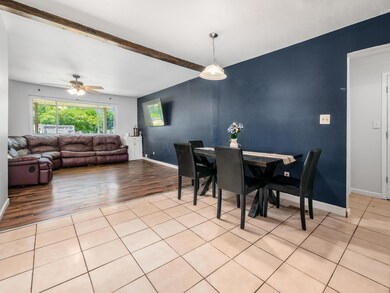
The spacious open living areas are ideal for relaxing or entertaining, and the garage—converted into a heated/cooled bonus room in the 1970s—offers flexible space for living or storage, with the potential to revert back to a single-car garage.
Selling ''AS IS'' and priced to move, this home is perfect for buyers looking for their first home or investors looking for a great opportunity. Schedule your personal tour today!
Home Details
Home Type
- Single Family
Est. Annual Taxes
- $1,716
Year Built
- Built in 1963
Lot Details
- 4,356 Sq Ft Lot
- Cul-De-Sac
Home Design
- Ranch Style House
- Brick Exterior Construction
- Slab Foundation
- Aluminum Siding
Interior Spaces
- 1,263 Sq Ft Home
- Insulated Windows
- Great Room
- Bonus Room
Kitchen
- Electric Range
- Microwave
Flooring
- Carpet
- Laminate
- Ceramic Tile
Bedrooms and Bathrooms
- 3 Bedrooms
- 1 Full Bathroom
Laundry
- Laundry on main level
- Electric Dryer Hookup
Parking
- No Garage
- On-Street Parking
- Off-Street Parking: 2
Utilities
- Central Air
- Heating System Uses Gas
Community Details
- No Home Owners Association
Listing and Financial Details
- Assessor Parcel Number 010-134740
Map
Home Values in the Area
Average Home Value in this Area
Tax History
| Year | Tax Paid | Tax Assessment Tax Assessment Total Assessment is a certain percentage of the fair market value that is determined by local assessors to be the total taxable value of land and additions on the property. | Land | Improvement |
|---|---|---|---|---|
| 2024 | $1,716 | $38,230 | $12,500 | $25,730 |
| 2023 | $1,694 | $38,220 | $12,495 | $25,725 |
| 2022 | $1,234 | $23,800 | $8,400 | $15,400 |
| 2021 | $1,317 | $23,800 | $8,400 | $15,400 |
| 2020 | $1,238 | $23,800 | $8,400 | $15,400 |
| 2019 | $1,196 | $19,710 | $7,000 | $12,710 |
| 2018 | $1,184 | $19,710 | $7,000 | $12,710 |
| 2017 | $1,252 | $19,710 | $7,000 | $12,710 |
| 2016 | $1,203 | $17,710 | $5,110 | $12,600 |
| 2015 | $1,145 | $17,710 | $5,110 | $12,600 |
| 2014 | $1,098 | $17,710 | $5,110 | $12,600 |
| 2013 | $697 | $19,670 | $5,670 | $14,000 |
Property History
| Date | Event | Price | List to Sale | Price per Sq Ft |
|---|---|---|---|---|
| 10/03/2025 10/03/25 | Pending | -- | -- | -- |
| 08/25/2025 08/25/25 | Price Changed | $194,500 | -1.8% | $154 / Sq Ft |
| 08/02/2025 08/02/25 | Price Changed | $198,000 | -3.4% | $157 / Sq Ft |
| 07/16/2025 07/16/25 | Price Changed | $205,000 | -3.3% | $162 / Sq Ft |
| 07/06/2025 07/06/25 | For Sale | $212,000 | -- | $168 / Sq Ft |
Purchase History
| Date | Type | Sale Price | Title Company |
|---|---|---|---|
| Warranty Deed | $57,000 | Independence Title Svcs Inc | |
| Warranty Deed | $57,000 | Independent Title Svsc | |
| Quit Claim Deed | -- | Attorney | |
| Interfamily Deed Transfer | -- | -- | |
| Certificate Of Transfer | -- | -- | |
| Deed | -- | -- |
Mortgage History
| Date | Status | Loan Amount | Loan Type |
|---|---|---|---|
| Previous Owner | $54,150 | New Conventional |
Source: Columbus and Central Ohio Regional MLS
MLS Number: 225024695
APN: 010-134740
Disclaimer: Certain information contained herein is derived from information provided by parties other than Homes.com. All information provided is deemed reliable, but is not guaranteed to be accurate and should be independently verified.
![]() IDX information is provided exclusively for personal, non-commercial use, and may not be used for any purpose other than to identify prospective properties consumers may be interested in purchasing.
IDX information is provided exclusively for personal, non-commercial use, and may not be used for any purpose other than to identify prospective properties consumers may be interested in purchasing.
Information is deemed reliable but not guaranteed.
- 1855 Zettler Rd
- 1778 Quigley Rd
- 1782 Newfield Rd
- 2866 Kingsrowe Ct Unit 38
- 1703 Quigley Rd
- 2846 Petzinger Rd Unit 70
- 3038 Wadsworth Ct
- 3036 Wadsworth Ct
- 1634 S James Rd
- 3050 Peters St
- 1677 Kenview Rd
- 2957 Ivanhoe Dr
- 1656 Miltwood Rd
- 2894 Landon Dr
- 2866 Landon Dr
- 1611 Miltwood Rd
- 3246 E Deshler Ave
- 1664 Barnett Rd
- 2903 Scottwood Rd
- 3325 E Deshler Ave
