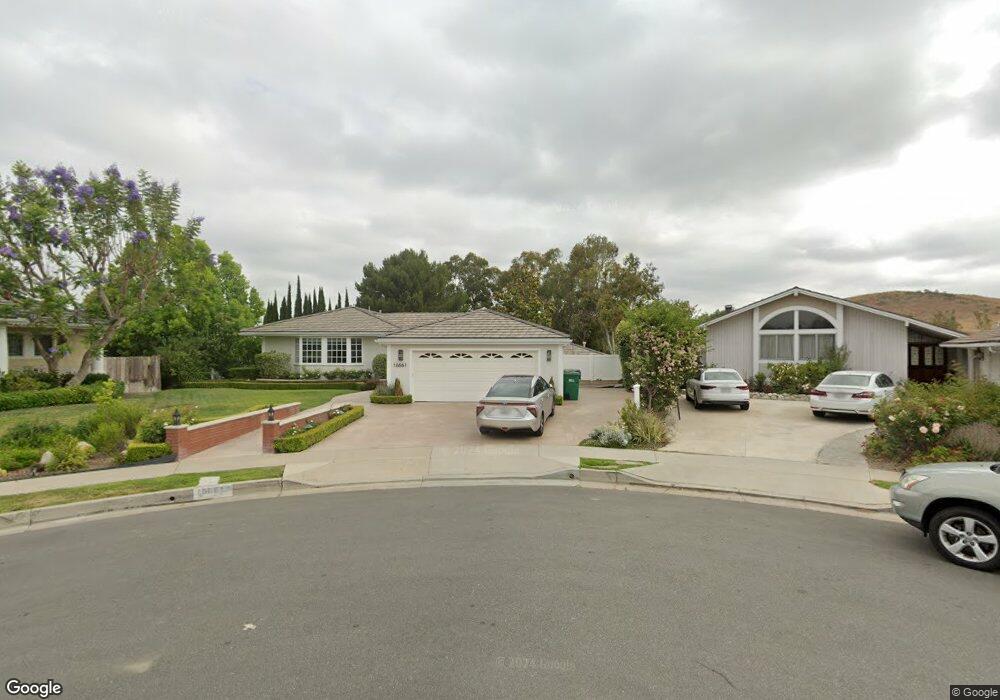
18661 Via Palatino Irvine, CA 92603
Turtle Rock NeighborhoodEstimated Value: $3,888,000 - $5,572,651
4
Beds
6
Baths
4,525
Sq Ft
$1,091/Sq Ft
Est. Value
About This Home
This home is located at 18661 Via Palatino, Irvine, CA 92603 and is currently estimated at $4,934,663, approximately $1,090 per square foot. 18661 Via Palatino is a home located in Orange County with nearby schools including Turtle Rock Elementary, Rancho San Joaquin Middle School, and University High School.
Ownership History
Date
Name
Owned For
Owner Type
Purchase Details
Closed on
Apr 6, 2017
Sold by
Mcphie Erin Holsinger and Mcphie David Craig
Bought by
Mcphie David and Mcphie Erin
Current Estimated Value
Purchase Details
Closed on
Jan 31, 2017
Sold by
Mcphie Erin Holsinger and Mcphie David Craig
Bought by
Mcphie David C and Mcphie Erin Holsinger
Home Financials for this Owner
Home Financials are based on the most recent Mortgage that was taken out on this home.
Original Mortgage
$2,000,000
Outstanding Balance
$1,014,254
Interest Rate
4.3%
Mortgage Type
New Conventional
Estimated Equity
$3,920,409
Purchase Details
Closed on
Feb 28, 2015
Sold by
Hannesson John D and Hannesson Kathryn P
Bought by
Mcphie Erin Holsinger and Mcphie David Craig
Home Financials for this Owner
Home Financials are based on the most recent Mortgage that was taken out on this home.
Original Mortgage
$1,858,400
Interest Rate
3.83%
Mortgage Type
New Conventional
Purchase Details
Closed on
Sep 13, 2012
Sold by
Hannesson John D and Hannesson Kathryn P
Bought by
Hannesson John D and Hannesson Kathryn P
Home Financials for this Owner
Home Financials are based on the most recent Mortgage that was taken out on this home.
Original Mortgage
$400,000
Interest Rate
3.55%
Mortgage Type
New Conventional
Purchase Details
Closed on
Dec 3, 2010
Sold by
Hannesson John D and Hannesson Kathryn P
Bought by
Hannesson John D and Hannesson Kathryn P
Home Financials for this Owner
Home Financials are based on the most recent Mortgage that was taken out on this home.
Original Mortgage
$372,115
Interest Rate
3.5%
Mortgage Type
New Conventional
Purchase Details
Closed on
Oct 3, 2008
Sold by
Hannesson John D and Hannesson Kathryn P
Bought by
Hannesson John D and Hannesson Kathryn P
Purchase Details
Closed on
Jul 9, 2008
Sold by
Hannesson John D and Hannesson Kathryn P
Bought by
Hannesson John D and Hannesson Kathryn P
Home Financials for this Owner
Home Financials are based on the most recent Mortgage that was taken out on this home.
Original Mortgage
$370,721
Interest Rate
6.12%
Mortgage Type
New Conventional
Purchase Details
Closed on
Jun 6, 2003
Sold by
Hannesson John D and Hannesson Kathryn P
Bought by
Hannesson John D and Hannesson Kathryn P
Home Financials for this Owner
Home Financials are based on the most recent Mortgage that was taken out on this home.
Original Mortgage
$374,000
Interest Rate
4.37%
Mortgage Type
Purchase Money Mortgage
Create a Home Valuation Report for This Property
The Home Valuation Report is an in-depth analysis detailing your home's value as well as a comparison with similar homes in the area
Home Values in the Area
Average Home Value in this Area
Purchase History
| Date | Buyer | Sale Price | Title Company |
|---|---|---|---|
| Mcphie David | -- | None Available | |
| Mcphie David C | -- | Corinthian Title Company | |
| Mcphie Erin Holsinger | $2,323,000 | First American Title Company | |
| Hannesson John D | -- | Lsi Title Company | |
| Hannesson John D | -- | Lsi Title Company | |
| Hannesson John D | -- | First Title | |
| Hannesson John D | -- | First Title | |
| Hannesson John D | -- | None Available | |
| Hannesson John D | -- | None Available | |
| Hannesson John D | -- | -- | |
| Hannesson John D | -- | Lawyers Title |
Source: Public Records
Mortgage History
| Date | Status | Borrower | Loan Amount |
|---|---|---|---|
| Open | Mcphie David C | $2,000,000 | |
| Previous Owner | Mcphie Erin Holsinger | $1,858,400 | |
| Previous Owner | Hannesson John D | $400,000 | |
| Previous Owner | Hannesson John D | $372,115 | |
| Previous Owner | Hannesson John D | $370,721 | |
| Previous Owner | Hannesson John D | $374,000 |
Source: Public Records
Tax History Compared to Growth
Tax History
| Year | Tax Paid | Tax Assessment Tax Assessment Total Assessment is a certain percentage of the fair market value that is determined by local assessors to be the total taxable value of land and additions on the property. | Land | Improvement |
|---|---|---|---|---|
| 2025 | $28,845 | $2,837,635 | $2,311,346 | $526,289 |
| 2024 | $28,845 | $2,781,996 | $2,266,026 | $515,970 |
| 2023 | $28,101 | $2,727,448 | $2,221,595 | $505,853 |
| 2022 | $27,599 | $2,673,969 | $2,178,034 | $495,935 |
| 2021 | $26,984 | $2,621,539 | $2,135,328 | $486,211 |
| 2020 | $26,833 | $2,594,659 | $2,113,433 | $481,226 |
| 2019 | $26,238 | $2,543,784 | $2,071,993 | $471,791 |
| 2018 | $25,785 | $2,493,906 | $2,031,365 | $462,541 |
| 2017 | $25,255 | $2,445,006 | $1,991,534 | $453,472 |
| 2016 | $23,438 | $2,323,000 | $1,952,484 | $370,516 |
| 2015 | $13,704 | $1,354,809 | $979,061 | $375,748 |
| 2014 | -- | $1,328,271 | $959,883 | $368,388 |
Source: Public Records
Map
Nearby Homes
- 18816 Saginaw Dr
- 18802 Saginaw Dr
- 21 Centaurus
- 15 Rocky Knoll
- 19 Rippling Stream
- 4886 Paseo de Vega
- 19112 Biddle Dr
- 19165 Beckwith Terrace
- 111 Hillcrest
- 3 Longbourn Aisle
- 17 Brigadier
- 53 Wellesley Unit 50
- 16 Wellesley Unit 2
- 7 Altair
- 53 Oxford Unit 14
- 21 Rustling Wind
- 17 Oxford Unit 28
- 28 Exeter Unit 19
- 10 Lassen
- 5821 Sierra Cielo Rd
- 18651 Via Palatino
- 18671 Via Palatino
- 18662 Via Torino
- 18642 Via Torino
- 18691 Via Palatino
- 18672 Via Torino
- 18662 Via Palatino
- 5 Morning Dew
- 18672 Via Palatino
- 3 Morning Dew
- 7 Morning Dew
- 1 Morning Dew
- 18701 Via Palatino
- 9 Morning Dew
- 18682 Via Torino
- 18692 Via Palatino
- 11 Morning Dew
- 18641 Via Torino
- 13 Morning Dew
- 18692 Via Torino