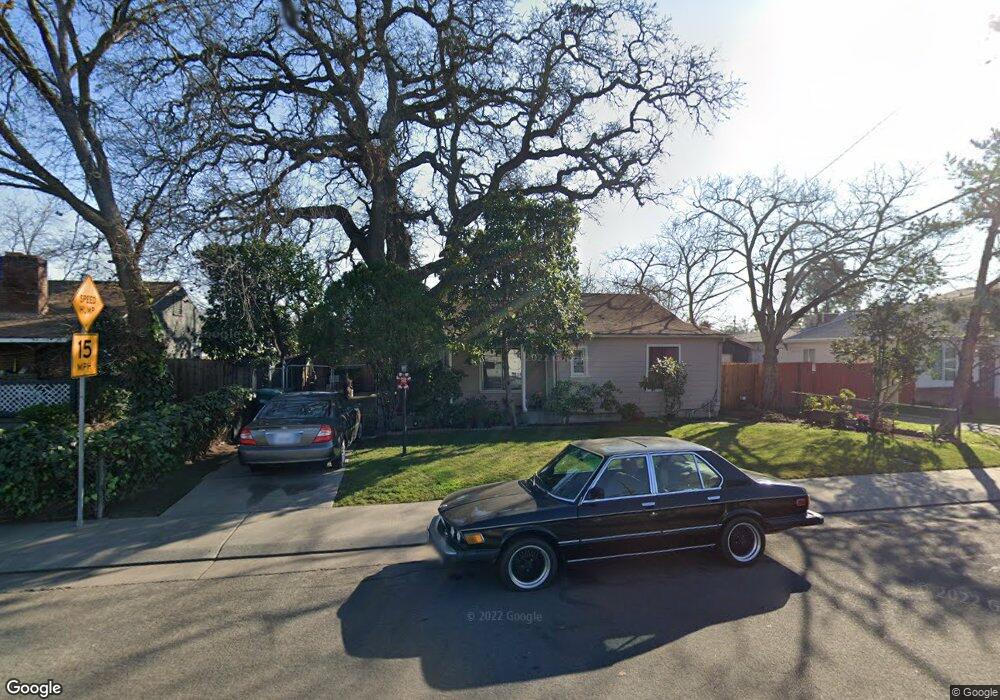
1868 Bishop St Stockton, CA 95205
Midtown NeighborhoodEstimated Value: $288,786 - $339,000
2
Beds
1
Bath
1,045
Sq Ft
$295/Sq Ft
Est. Value
About This Home
This home is located at 1868 Bishop St, Stockton, CA 95205 and is currently estimated at $308,697, approximately $295 per square foot. 1868 Bishop St is a home located in San Joaquin County with nearby schools including Grunsky Elementary School, Harrison Elementary School, and August Elementary School.
Ownership History
Date
Name
Owned For
Owner Type
Purchase Details
Closed on
Mar 19, 2025
Sold by
Cervantes Jose Alfredo
Bought by
Cervantes Jose Alfredo
Current Estimated Value
Home Financials for this Owner
Home Financials are based on the most recent Mortgage that was taken out on this home.
Original Mortgage
$245,000
Outstanding Balance
$242,092
Interest Rate
6.87%
Mortgage Type
New Conventional
Estimated Equity
$66,605
Purchase Details
Closed on
Jul 13, 2022
Sold by
Alfredo Cervantes Jose
Bought by
Cervantes Jose Alfredo
Home Financials for this Owner
Home Financials are based on the most recent Mortgage that was taken out on this home.
Original Mortgage
$200,000
Interest Rate
4.81%
Mortgage Type
New Conventional
Purchase Details
Closed on
Sep 4, 2003
Sold by
Salazar Miguel
Bought by
Salazar Socorro
Home Financials for this Owner
Home Financials are based on the most recent Mortgage that was taken out on this home.
Original Mortgage
$58,300
Interest Rate
5.87%
Mortgage Type
Purchase Money Mortgage
Create a Home Valuation Report for This Property
The Home Valuation Report is an in-depth analysis detailing your home's value as well as a comparison with similar homes in the area
Home Values in the Area
Average Home Value in this Area
Purchase History
| Date | Buyer | Sale Price | Title Company |
|---|---|---|---|
| Cervantes Jose Alfredo | -- | Title Connect | |
| Cervantes Jose Alfredo | -- | None Listed On Document | |
| Salazar Socorro | -- | Alliance Title Co | |
| Salazar Socorro | -- | Alliance Title Company |
Source: Public Records
Mortgage History
| Date | Status | Borrower | Loan Amount |
|---|---|---|---|
| Open | Cervantes Jose Alfredo | $245,000 | |
| Previous Owner | Cervantes Jose Alfredo | $200,000 | |
| Previous Owner | Salazar Socorro | $58,300 |
Source: Public Records
Tax History Compared to Growth
Tax History
| Year | Tax Paid | Tax Assessment Tax Assessment Total Assessment is a certain percentage of the fair market value that is determined by local assessors to be the total taxable value of land and additions on the property. | Land | Improvement |
|---|---|---|---|---|
| 2025 | $705 | $48,895 | $9,678 | $39,217 |
| 2024 | $693 | $47,938 | $9,489 | $38,449 |
| 2023 | $661 | $46,999 | $9,303 | $37,696 |
| 2022 | $603 | $46,078 | $9,121 | $36,957 |
| 2021 | $580 | $45,176 | $8,943 | $36,233 |
| 2020 | $591 | $44,714 | $8,852 | $35,862 |
| 2019 | $588 | $43,838 | $8,679 | $35,159 |
| 2018 | $577 | $42,979 | $8,509 | $34,470 |
| 2017 | $548 | $42,138 | $8,343 | $33,795 |
| 2016 | $557 | $41,313 | $8,180 | $33,133 |
| 2014 | $532 | $39,895 | $7,899 | $31,996 |
Source: Public Records
Map
Nearby Homes
- 1751 Sycamore Ave
- 1751 Sunnyside Ave
- 1711 E Walnut St
- 1702 Sunnyside Ave
- 1620 Sycamore Ave
- 1600 Sunnyside Ave
- 1372 Bradford St
- 1902 E Harding Way
- 1257 Sunnyside Ave
- 1818 West Ln
- 1272 N Airport Way
- 1404 Williams St
- 2340 Sanguinetti Ln Unit 54
- 1450 Belvedere Ave
- 1813 E Anita St
- 1155 N Pilgrim St
- 1825 N Filbert St
- 1135 N Pilgrim St
- 1561 N Filbert St
- 2484 Francis St
- 1870 Bishop St
- 1826 Bishop St
- 1904 Bishop St
- 1820 Bishop St
- 1827 Bradford St
- 1835 Bradford St
- 1817 Bradford St
- 1841 Bradford St
- 1815 Bishop St
- 1811 Bradford St
- 1916 Bishop St
- 1902 N Funston Ave
- 1901 Bradford St
- 1808 Bishop St
- 1803 Bradford St
- 1861 Bishop St
- 1850 N Funston Ave
- 1918 N Funston Ave
- 1903 Bradford St
- 1924 Bishop St