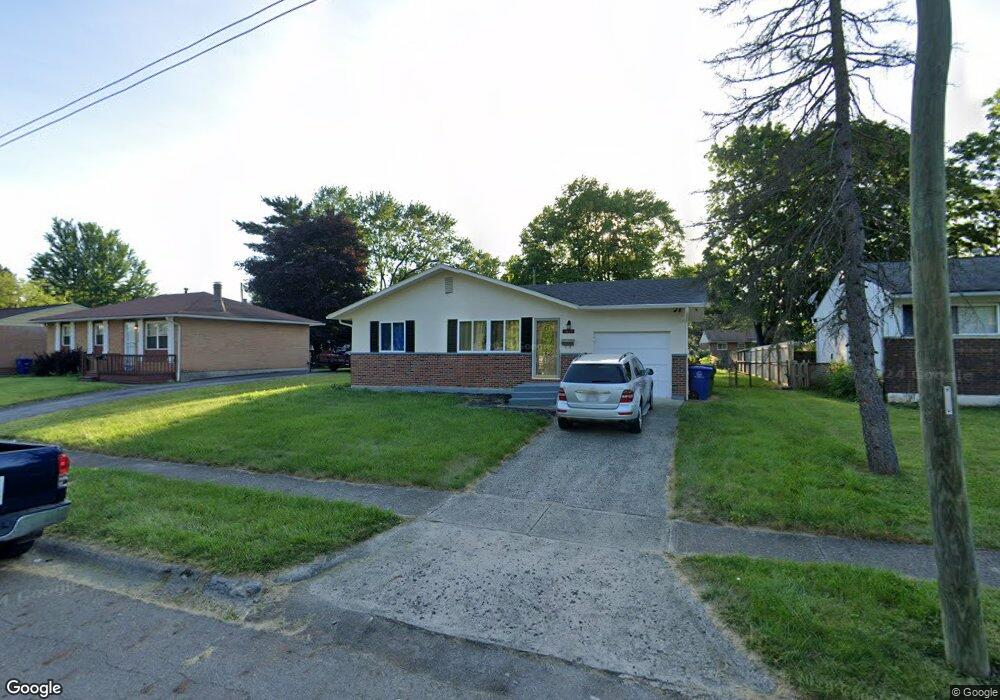
1869 Stetson Rd Columbus, OH 43232
Pine Hills NeighborhoodEstimated Value: $157,373 - $212,000
3
Beds
2
Baths
986
Sq Ft
$195/Sq Ft
Est. Value
About This Home
This home is located at 1869 Stetson Rd, Columbus, OH 43232 and is currently estimated at $192,343, approximately $195 per square foot. 1869 Stetson Rd is a home located in Franklin County with nearby schools including Woodcrest Elementary School, Sherwood Middle School, and Walnut Ridge High School.
Ownership History
Date
Name
Owned For
Owner Type
Purchase Details
Closed on
Jul 16, 2010
Sold by
Mccollum Eddie S and Mccollum Karen
Bought by
Beyene Amare N
Current Estimated Value
Purchase Details
Closed on
Feb 28, 2002
Sold by
Comer Patrick J and Comer Debhi L
Bought by
Mccollum Eddie S
Home Financials for this Owner
Home Financials are based on the most recent Mortgage that was taken out on this home.
Original Mortgage
$86,830
Interest Rate
9.25%
Mortgage Type
Purchase Money Mortgage
Purchase Details
Closed on
Oct 25, 2001
Sold by
Gordon Patricia A
Bought by
Comer Patrick J
Home Financials for this Owner
Home Financials are based on the most recent Mortgage that was taken out on this home.
Original Mortgage
$70,000
Interest Rate
6.72%
Mortgage Type
Purchase Money Mortgage
Purchase Details
Closed on
Jun 10, 1966
Bought by
Gordon Patricia A
Create a Home Valuation Report for This Property
The Home Valuation Report is an in-depth analysis detailing your home's value as well as a comparison with similar homes in the area
Home Values in the Area
Average Home Value in this Area
Purchase History
| Date | Buyer | Sale Price | Title Company |
|---|---|---|---|
| Beyene Amare N | $39,000 | Talon Group | |
| Mccollum Eddie S | $91,900 | -- | |
| Comer Patrick J | $71,000 | -- | |
| Gordon Patricia A | -- | -- |
Source: Public Records
Mortgage History
| Date | Status | Borrower | Loan Amount |
|---|---|---|---|
| Previous Owner | Mccollum Eddie S | $86,830 | |
| Previous Owner | Comer Patrick J | $70,000 |
Source: Public Records
Tax History
| Year | Tax Paid | Tax Assessment Tax Assessment Total Assessment is a certain percentage of the fair market value that is determined by local assessors to be the total taxable value of land and additions on the property. | Land | Improvement |
|---|---|---|---|---|
| 2025 | $2,157 | $48,060 | $13,090 | $34,970 |
| 2024 | $2,157 | $48,060 | $13,090 | $34,970 |
| 2023 | $2,129 | $48,055 | $13,090 | $34,965 |
| 2022 | $1,414 | $27,270 | $6,130 | $21,140 |
| 2021 | $1,417 | $27,270 | $6,130 | $21,140 |
| 2020 | $1,419 | $27,270 | $6,130 | $21,140 |
| 2019 | $1,293 | $21,320 | $4,900 | $16,420 |
| 2018 | $1,172 | $21,320 | $4,900 | $16,420 |
| 2017 | $1,226 | $21,320 | $4,900 | $16,420 |
| 2016 | $1,159 | $17,500 | $4,970 | $12,530 |
| 2015 | $1,052 | $17,500 | $4,970 | $12,530 |
| 2014 | $1,412 | $23,420 | $4,970 | $18,450 |
| 2013 | $773 | $26,005 | $5,530 | $20,475 |
Source: Public Records
Map
Nearby Homes
- 5337 Ivyhurst Dr
- 1759 Lonsdale Rd
- 5207 Kornwal Dr
- 1963 Birkdale Dr
- 1945 Riverdale Rd
- 1905 Woodcrest Rd
- 5368 Yorkshire Village Ln Unit B23
- 1797 Quarry Ridge Dr Unit A
- 1557 Jennifer Ct Unit B
- 5144 Botsford Dr
- 5778 Lucinda Ct Unit 5778
- 1590 Jacqueline Ct
- 5762 Hallridge Cir
- 1591 Stephanie Ct Unit 15912
- 1470 Efner Dr
- 5114 Carbondale Dr
- 1472 Blaine Dr
- 5123 Carbondale Dr
- 0 Noe Bixby Rd
- 2651 Brownfield Rd
- 1861 Stetson Rd
- 1875 Stetson Rd
- 1855 Stetson Rd
- 1883 Stetson Rd
- 1856 Lonsdale Rd
- 1864 Lonsdale Rd
- 1848 Lonsdale Rd
- 1870 Lonsdale Rd
- 1849 Stetson Rd
- 1840 Lonsdale Rd
- 1872 Stetson Rd
- 1866 Stetson Rd
- 1891 Stetson Rd
- 1860 Stetson Rd
- 1878 Stetson Rd
- 1832 Lonsdale Rd
- 1854 Stetson Rd
- 1886 Stetson Rd
- 1841 Stetson Rd
- 1890 Lonsdale Rd
Your Personal Tour Guide
Ask me questions while you tour the home.