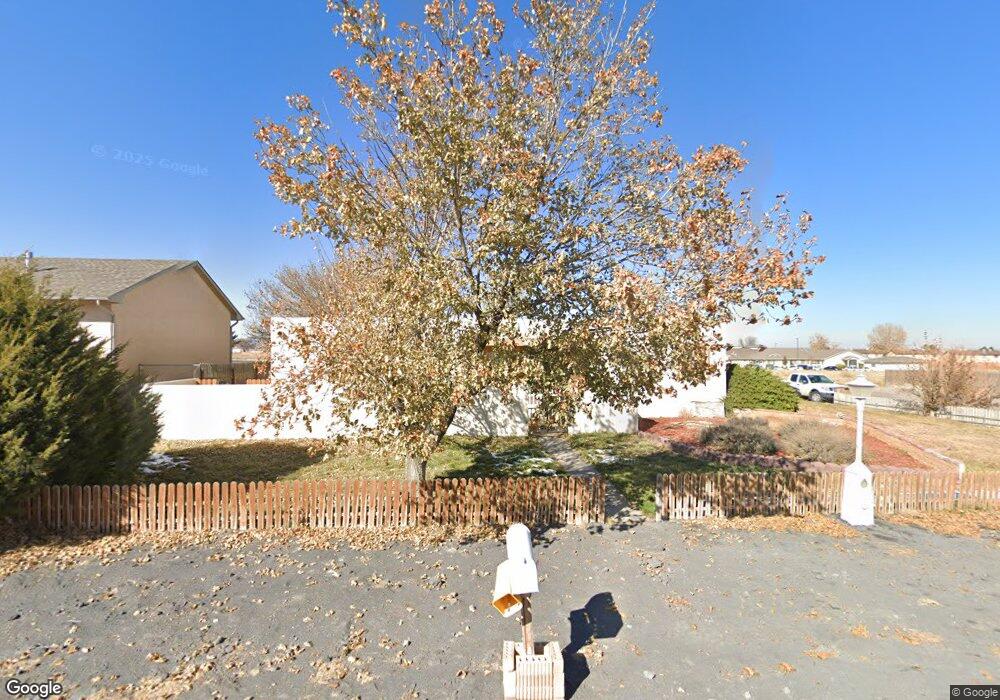
187 E Abarr Dr Pueblo, CO 81007
Estimated Value: $338,000 - $347,575
3
Beds
2
Baths
1,912
Sq Ft
$179/Sq Ft
Est. Value
About This Home
This home is located at 187 E Abarr Dr, Pueblo, CO 81007 and is currently estimated at $342,644, approximately $179 per square foot. 187 E Abarr Dr is a home located in Pueblo County with nearby schools including Liberty Point Elementary School, Liberty Point International School, and Pueblo West High School.
Ownership History
Date
Name
Owned For
Owner Type
Purchase Details
Closed on
Jun 22, 2017
Sold by
Johns Eugene Plemons
Bought by
Niblick Christopher L
Current Estimated Value
Home Financials for this Owner
Home Financials are based on the most recent Mortgage that was taken out on this home.
Original Mortgage
$174,775
Outstanding Balance
$145,496
Interest Rate
4.05%
Mortgage Type
FHA
Estimated Equity
$197,148
Purchase Details
Closed on
Nov 1, 2001
Sold by
Lentz James A + Jana L
Bought by
Johns Eugene P + Mary L
Purchase Details
Closed on
Feb 26, 1999
Sold by
Lerch Bobby J + Kim A
Bought by
Lentz James A + Jana L
Purchase Details
Closed on
Jan 25, 1999
Bought by
Lerch Bobby J
Purchase Details
Closed on
Nov 4, 1992
Bought by
Lerch Bobby J + Kim A
Purchase Details
Closed on
Jul 7, 1987
Bought by
Zavisian Michae + Randi E
Purchase Details
Closed on
Oct 29, 1982
Bought by
Arguello Silviano + Linad M
Create a Home Valuation Report for This Property
The Home Valuation Report is an in-depth analysis detailing your home's value as well as a comparison with similar homes in the area
Home Values in the Area
Average Home Value in this Area
Purchase History
| Date | Buyer | Sale Price | Title Company |
|---|---|---|---|
| Niblick Christopher L | $178,000 | Fidelity National Title Ins | |
| Johns Eugene P + Mary L | $110,000 | -- | |
| Lentz James A + Jana L | $99,900 | -- | |
| Lerch Bobby J | -- | -- | |
| Lerch Bobby J + Kim A | $78,900 | -- | |
| Zavisian Michae + Randi E | $61,000 | -- | |
| Arguello Silviano + Linad M | $43,000 | -- |
Source: Public Records
Mortgage History
| Date | Status | Borrower | Loan Amount |
|---|---|---|---|
| Open | Niblick Christopher L | $174,775 |
Source: Public Records
Tax History
| Year | Tax Paid | Tax Assessment Tax Assessment Total Assessment is a certain percentage of the fair market value that is determined by local assessors to be the total taxable value of land and additions on the property. | Land | Improvement |
|---|---|---|---|---|
| 2024 | $1,908 | $19,010 | -- | -- |
| 2023 | $1,930 | $22,700 | $3,350 | $19,350 |
| 2022 | $1,603 | $15,971 | $2,090 | $13,881 |
| 2021 | $1,643 | $16,430 | $2,150 | $14,280 |
| 2020 | $1,505 | $16,430 | $2,150 | $14,280 |
| 2019 | $1,502 | $15,027 | $572 | $14,455 |
| 2018 | $1,278 | $12,785 | $490 | $12,295 |
| 2017 | $576 | $12,785 | $490 | $12,295 |
| 2016 | $534 | $10,593 | $716 | $9,877 |
| 2015 | $529 | $10,593 | $716 | $9,877 |
| 2014 | $480 | $9,601 | $796 | $8,805 |
Source: Public Records
Map
Nearby Homes
- 142 E Croyden Dr
- 257 S Bailey Dr
- 157 S Stardust Cir
- 162 S Del Monte Place
- 151 S Casa Monterey Way
- 48 W Carmel Ct
- 179 S Carmel Ct
- 226 E Falcon Dr
- 362 E Larchmont Dr
- 385 E Larchmont Dr
- 288 S Wiggins Dr
- 56 E Industrial Blvd
- 75 S Villa Del Sol Ct
- 338 E Fraser Dr
- 357 S Joe Martinez Blvd
- 89 Precision Dr
- 20 W Hahns Peak Ave
- 210 W Venturi Dr
- 348 S Del Norte Ave
- 349 S Joe Martinez Blvd
- 175 E Abarr Dr
- 201 S Dacona Dr
- 211 E Abarr Dr
- 168 E Abarr Dr
- 212 E Abarr Dr
- 151 E Abarr Dr
- 205 S Dacona Dr
- 204 S Caddoa Dr
- 204 S Dacona Dr
- 208 S Caddoa Dr
- 209 S Dacona Dr
- 160 S Abarr Dr
- 203 S Caddoa Dr
- 125 E Abarr Dr
- 208 S Dacona Dr
- 212 S Caddoa Dr
- 212 S Caddoa Dr Unit 15
- 211 S Caddoa Dr
- 216 S Caddoa Dr
- 163 S Wiggins Dr
Your Personal Tour Guide
Ask me questions while you tour the home.