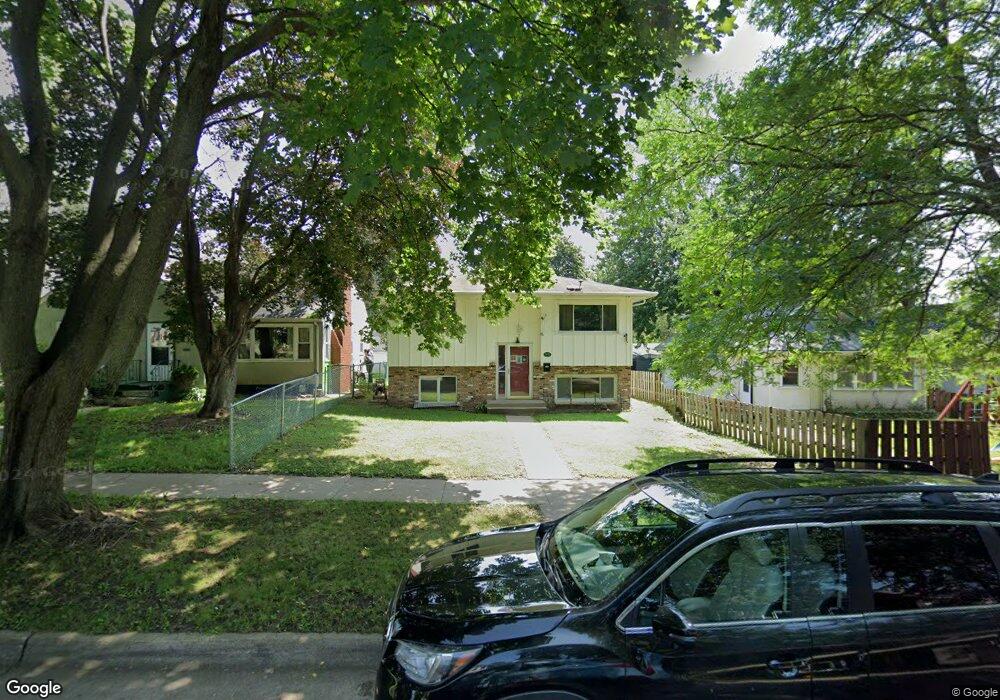
1870 1870 Orange-Avenue-e St. Paul, MN 55119
Southern Hayden Heights NeighborhoodEstimated Value: $283,000 - $305,000
3
Beds
2
Baths
953
Sq Ft
$309/Sq Ft
Est. Value
About This Home
This home is located at 1870 1870 Orange-Avenue-e, St. Paul, MN 55119 and is currently estimated at $294,204, approximately $308 per square foot. 1870 1870 Orange-Avenue-e is a home located in Ramsey County with nearby schools including The Heights Community School, Txuj Ci HMong Language and Culture Upper Campus, and Johnson Senior High School.
Ownership History
Date
Name
Owned For
Owner Type
Purchase Details
Closed on
May 13, 2022
Sold by
Thao Mao
Bought by
Vue Xue and Chang Xee
Current Estimated Value
Home Financials for this Owner
Home Financials are based on the most recent Mortgage that was taken out on this home.
Original Mortgage
$271,600
Outstanding Balance
$256,624
Interest Rate
4.67%
Mortgage Type
New Conventional
Estimated Equity
$37,580
Purchase Details
Closed on
May 3, 2022
Sold by
Mao Thao
Bought by
Vue Xue and Chang Xee
Home Financials for this Owner
Home Financials are based on the most recent Mortgage that was taken out on this home.
Original Mortgage
$271,600
Outstanding Balance
$256,624
Interest Rate
4.67%
Mortgage Type
New Conventional
Estimated Equity
$37,580
Purchase Details
Closed on
Feb 22, 2008
Sold by
Us Bank Na
Bought by
Root Orin and Root Paula
Purchase Details
Closed on
Nov 25, 2002
Sold by
Mccape Thomas A
Bought by
Kim Vang and Thao Yang
Create a Home Valuation Report for This Property
The Home Valuation Report is an in-depth analysis detailing your home's value as well as a comparison with similar homes in the area
Home Values in the Area
Average Home Value in this Area
Purchase History
| Date | Buyer | Sale Price | Title Company |
|---|---|---|---|
| Vue Xue | $280,000 | -- | |
| Vue Xue | $280,000 | Rg Title | |
| Root Orin | $90,000 | -- | |
| Kim Vang | $166,500 | -- |
Source: Public Records
Mortgage History
| Date | Status | Borrower | Loan Amount |
|---|---|---|---|
| Open | Vue Xue | $271,600 | |
| Closed | Vue Xue | $271,600 | |
| Closed | Vue Xue | $271,600 |
Source: Public Records
Tax History Compared to Growth
Tax History
| Year | Tax Paid | Tax Assessment Tax Assessment Total Assessment is a certain percentage of the fair market value that is determined by local assessors to be the total taxable value of land and additions on the property. | Land | Improvement |
|---|---|---|---|---|
| 2025 | $4,154 | $292,700 | $30,000 | $262,700 |
| 2023 | $4,154 | $275,900 | $25,000 | $250,900 |
| 2022 | $3,680 | $291,700 | $25,000 | $266,700 |
| 2021 | $3,254 | $238,600 | $25,000 | $213,600 |
| 2020 | $3,064 | $220,700 | $19,400 | $201,300 |
| 2019 | $2,976 | $196,700 | $19,400 | $177,300 |
| 2018 | $2,826 | $189,100 | $19,400 | $169,700 |
| 2017 | $2,306 | $185,800 | $19,400 | $166,400 |
| 2016 | $2,192 | $0 | $0 | $0 |
| 2015 | $2,106 | $150,000 | $19,400 | $130,600 |
| 2014 | $2,172 | $0 | $0 | $0 |
Source: Public Records
Map
Nearby Homes
- 1891 Maryland Ave E
- 1868 Ivy Ave E
- 1931 Hawthorne Ave E
- 1976 Orange Ave E
- 1755 Maryland Ave E
- 1732 Maryland Ave E
- 1806 Sherwood Ave
- 2032 Hyacinth Ave E
- 1711 Maryland Ave E
- 1126 Breen St
- 1828 Arlington Ave E
- 1111 Breen St
- 1675 Maryland Ave E
- 1406 Furness Pkwy
- 1664 Orange Ave E
- 1964 Arlington Ave E
- 1729 Sherwood Ave
- 1698 Arlington Ave E
- 1181 Herbert St
- 2112 Cottage Ave E
- 1870 Orange Ave E
- 1866 Orange Ave E
- 1866 1866 Orange-Avenue-e
- 1874 Orange Ave E
- 1878 Orange Ave E
- 1862 Orange Ave E
- 1852 Orange Ave E
- 1852 1852 E Orange-Avenue-e
- 1882 Orange Ave E
- 1867 Hawthorne Ave E
- 1865 Hawthorne Ave E
- 1873 Hawthorne Ave E
- 1856 Orange Ave E
- 1859 Hawthorne Ave E
- 1881 Hawthorne Ave E
- 1869 Orange Ave E
- 1869 1869 Orange-Avenue-e
- 1865 Orange Ave E
- 1873 Orange Ave E
- 1861 Orange Ave E