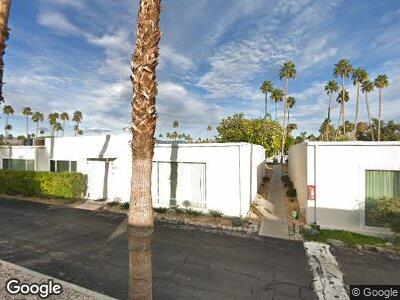
1870 Sandcliff Rd Palm Springs, CA 92264
Araby Commons NeighborhoodEstimated Value: $511,290 - $679,000
2
Beds
2
Baths
1,512
Sq Ft
$401/Sq Ft
Est. Value
About This Home
This home is located at 1870 Sandcliff Rd, Palm Springs, CA 92264 and is currently estimated at $606,823, approximately $401 per square foot. 1870 Sandcliff Rd is a home located in Riverside County with nearby schools including Cahuilla Elementary School, Raymond Cree Middle School, and Palm Springs High School.
Ownership History
Date
Name
Owned For
Owner Type
Purchase Details
Closed on
Jun 6, 2013
Sold by
Fiddick Lindsay Shirley
Bought by
Falcone Michael P
Current Estimated Value
Purchase Details
Closed on
Aug 7, 2009
Sold by
Cooper Perry and Cooper Shari
Bought by
Fiddick Lindsay Shirley
Purchase Details
Closed on
May 21, 2008
Sold by
Horton Satania
Bought by
Cooper Perry and Cooper Shari
Purchase Details
Closed on
May 8, 2008
Sold by
Horton Satania
Bought by
Kester Barbara
Purchase Details
Closed on
Jul 20, 2007
Sold by
Kester Barbara and Horton Satania
Bought by
Horton Satania
Home Financials for this Owner
Home Financials are based on the most recent Mortgage that was taken out on this home.
Original Mortgage
$125,000
Interest Rate
6.73%
Mortgage Type
Stand Alone Refi Refinance Of Original Loan
Purchase Details
Closed on
Mar 9, 1999
Sold by
Marion Newman
Bought by
Newman Marion
Create a Home Valuation Report for This Property
The Home Valuation Report is an in-depth analysis detailing your home's value as well as a comparison with similar homes in the area
Home Values in the Area
Average Home Value in this Area
Purchase History
| Date | Buyer | Sale Price | Title Company |
|---|---|---|---|
| Falcone Michael P | -- | None Available | |
| Fiddick Lindsay Shirley | $189,000 | Stewart Title Of California | |
| Cooper Perry | $142,750 | None Available | |
| Kester Barbara | -- | None Available | |
| Horton Satania | -- | Alliance Title Company | |
| Newman Marion | -- | -- |
Source: Public Records
Mortgage History
| Date | Status | Borrower | Loan Amount |
|---|---|---|---|
| Previous Owner | Horton Satania | $125,000 | |
| Previous Owner | Newman Marion | $35,500 |
Source: Public Records
Tax History Compared to Growth
Tax History
| Year | Tax Paid | Tax Assessment Tax Assessment Total Assessment is a certain percentage of the fair market value that is determined by local assessors to be the total taxable value of land and additions on the property. | Land | Improvement |
|---|---|---|---|---|
| 2023 | $3,169 | $234,473 | $58,612 | $175,861 |
| 2022 | $3,230 | $229,876 | $57,463 | $172,413 |
| 2021 | $3,168 | $225,370 | $56,337 | $169,033 |
| 2020 | $3,033 | $223,060 | $55,760 | $167,300 |
| 2019 | $2,984 | $218,687 | $54,667 | $164,020 |
| 2018 | $2,931 | $214,400 | $53,596 | $160,804 |
| 2017 | $2,890 | $210,197 | $52,546 | $157,651 |
| 2016 | $2,810 | $206,076 | $51,516 | $154,560 |
| 2015 | $2,460 | $184,000 | $46,000 | $138,000 |
| 2014 | $2,462 | $184,000 | $46,000 | $138,000 |
Source: Public Records
Map
Nearby Homes
- 1859 Sandcliff Rd
- 1810 Sandcliff Rd
- 2525 E Morongo Trail
- 2779 Princess Ln
- 1881 S Araby Dr Unit 16
- 1881 S Araby Dr Unit 25
- 1793 Pintura Cir W
- 1981 Rancho Vista Trail
- 2716 Anza Trail
- 1770 S Araby Dr
- 1772 S Araby Dr
- 1784 S Araby Dr Unit 19
- 2840 Belleza Ct
- 2645 Anza Trail
- 2943 Candlelight Ln
- 2938 Twilight Ln
- 2454 E Palm Canyon Dr Unit 1A
- 2454 E Palm Canyon Dr Unit 2C
- 1660 S La Reina Way Unit 1B
- 1630 S La Reina Way Unit 2A