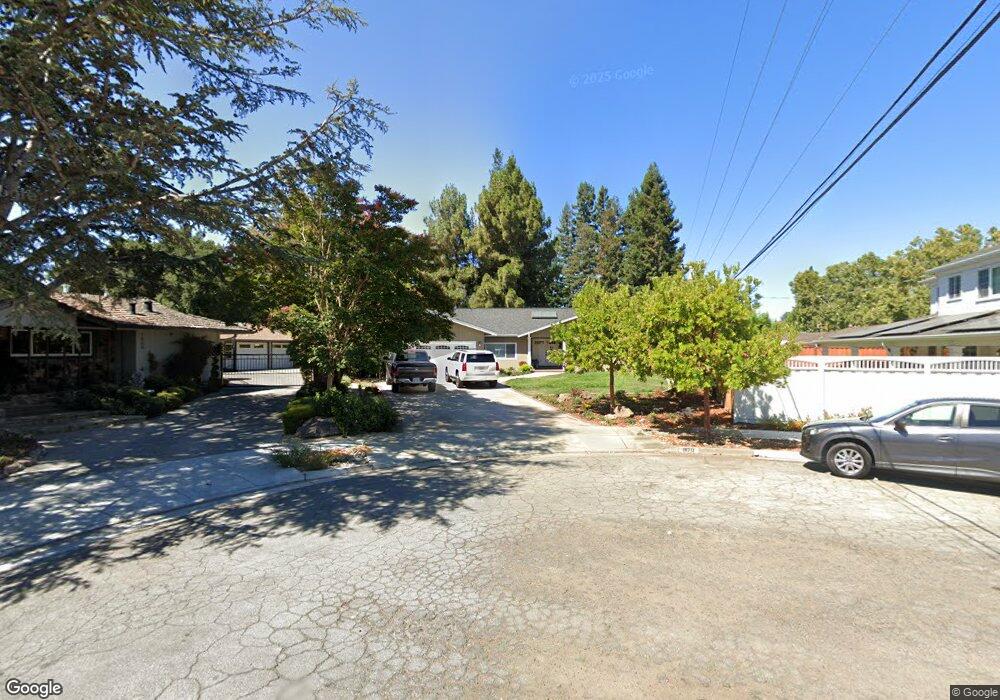
1870 Thunderbird Way San Jose, CA 95125
Willow Glen NeighborhoodEstimated Value: $2,801,000 - $3,672,000
4
Beds
3
Baths
2,182
Sq Ft
$1,536/Sq Ft
Est. Value
About This Home
This home is located at 1870 Thunderbird Way, San Jose, CA 95125 and is currently estimated at $3,350,578, approximately $1,535 per square foot. 1870 Thunderbird Way is a home located in Santa Clara County with nearby schools including Del Mar High School, Blackford Elementary, and Fammatre Elementary School.
Ownership History
Date
Name
Owned For
Owner Type
Purchase Details
Closed on
Sep 13, 2004
Sold by
Rutlen Steven J
Bought by
Stenseth David J and Stenseth Anne M
Current Estimated Value
Home Financials for this Owner
Home Financials are based on the most recent Mortgage that was taken out on this home.
Original Mortgage
$900,000
Outstanding Balance
$226,089
Interest Rate
4.87%
Mortgage Type
Purchase Money Mortgage
Estimated Equity
$3,124,489
Purchase Details
Closed on
Sep 25, 2000
Sold by
Rojas Audrey M and Rojas Rual S
Bought by
Rutlen Steven J
Home Financials for this Owner
Home Financials are based on the most recent Mortgage that was taken out on this home.
Original Mortgage
$727,500
Interest Rate
8%
Purchase Details
Closed on
May 21, 1998
Sold by
Audrey Faltersack and Audrey M
Bought by
Rojas Rual S and Rojas Audrey M
Home Financials for this Owner
Home Financials are based on the most recent Mortgage that was taken out on this home.
Original Mortgage
$225,000
Interest Rate
7.13%
Mortgage Type
Credit Line Revolving
Create a Home Valuation Report for This Property
The Home Valuation Report is an in-depth analysis detailing your home's value as well as a comparison with similar homes in the area
Home Values in the Area
Average Home Value in this Area
Purchase History
| Date | Buyer | Sale Price | Title Company |
|---|---|---|---|
| Stenseth David J | $1,250,000 | Chicago Title | |
| Rutlen Steven J | $970,000 | First American Title Co | |
| Rojas Rual S | -- | First American Title Ins Co |
Source: Public Records
Mortgage History
| Date | Status | Borrower | Loan Amount |
|---|---|---|---|
| Open | Stenseth David J | $900,000 | |
| Previous Owner | Rutlen Steven J | $727,500 | |
| Previous Owner | Rojas Rual S | $225,000 |
Source: Public Records
Tax History Compared to Growth
Tax History
| Year | Tax Paid | Tax Assessment Tax Assessment Total Assessment is a certain percentage of the fair market value that is determined by local assessors to be the total taxable value of land and additions on the property. | Land | Improvement |
|---|---|---|---|---|
| 2025 | $24,313 | $1,872,334 | $1,045,430 | $826,904 |
| 2024 | $24,313 | $1,835,623 | $1,024,932 | $810,691 |
| 2023 | $23,895 | $1,799,632 | $1,004,836 | $794,796 |
| 2022 | $23,661 | $1,764,346 | $985,134 | $779,212 |
| 2021 | $23,236 | $1,729,752 | $965,818 | $763,934 |
| 2020 | $22,615 | $1,712,016 | $955,915 | $756,101 |
| 2019 | $21,850 | $1,678,448 | $937,172 | $741,276 |
| 2018 | $21,255 | $1,645,539 | $918,797 | $726,742 |
| 2017 | $21,000 | $1,613,275 | $900,782 | $712,493 |
| 2016 | $19,816 | $1,581,643 | $883,120 | $698,523 |
| 2015 | $19,558 | $1,557,886 | $869,855 | $688,031 |
| 2014 | $18,675 | $1,527,370 | $852,816 | $674,554 |
Source: Public Records
Map
Nearby Homes
- 1829 Cabana Dr
- 1860 Leigh Ave
- 1898 Meridian Ave Unit 29
- 2392 Walden Square
- 2322 Meridian Ave
- 1791 Frobisher Way
- 2538 Custer Dr
- 2498 Raleigh Dr
- 1721 Braddock Ct
- 1735 Whispering Willow Place
- 1751 Braddock Ct
- 2425 Briarwood Dr
- 2538 Saint Lawrence Dr
- 866 Apricot Ave Unit C
- 912 Campisi Way Unit 115
- 912 Campisi Way Unit 201
- 1741 Harte Dr
- 1831 Ashmeade Ct
- 70 Union Place
- 1932 Huxley Ct
- 1890 Arroyo Seco Dr
- 1874 Arroyo Seco Dr
- 1868 Thunderbird Way
- 2303 Dry Creek Rd
- 1900 Arroyo Seco Dr
- 2301 Dry Creek Rd
- 2323 Dry Creek Rd
- 1860 Arroyo Seco Dr
- 1864 Thunderbird Way
- 1918 Arroyo Seco Dr
- 2275 Dry Creek Rd
- 1881 Arroyo Seco Dr
- 1875 Arroyo Seco Dr
- 1901 Arroyo Seco Dr
- 1861 Arroyo Seco Dr
- 1844 Arroyo Seco Dr
- 1950 Leigh Ann Place
- 1936 Arroyo Seco Dr
- 1828 Monte Carlo Way
- 1919 Arroyo Seco Dr