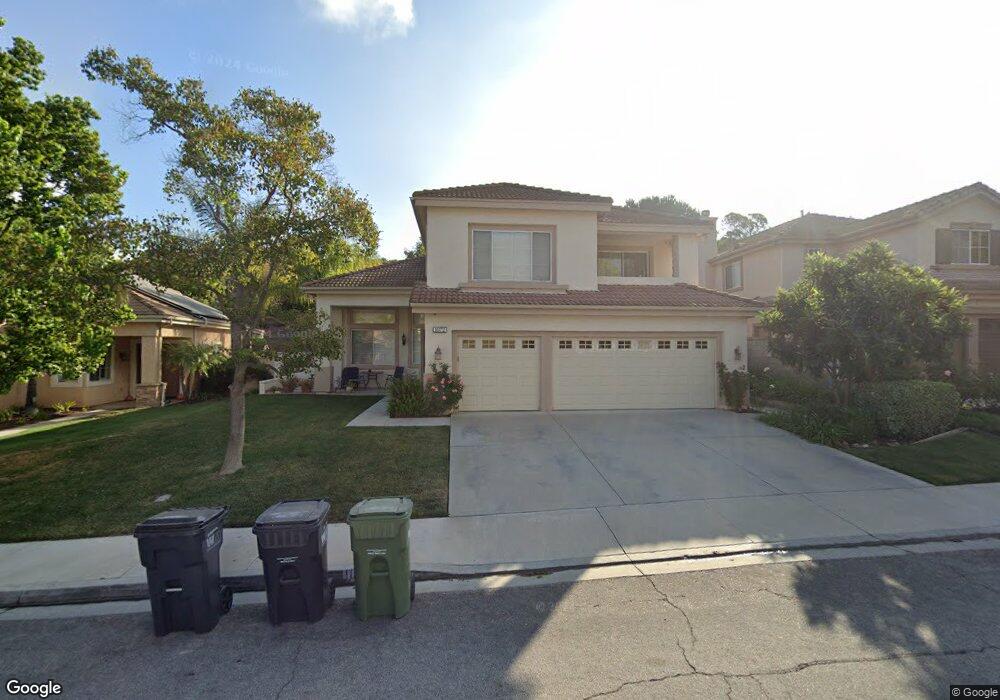
1872 Autumn Place Simi Valley, CA 93065
West Simi Valley NeighborhoodEstimated Value: $1,108,803 - $1,201,000
4
Beds
--
Bath
2,571
Sq Ft
$444/Sq Ft
Est. Value
About This Home
This home is located at 1872 Autumn Place, Simi Valley, CA 93065 and is currently estimated at $1,142,201, approximately $444 per square foot. 1872 Autumn Place is a home located in Ventura County with nearby schools including Arroyo Elementary School, Sinaloa Middle School, and Royal High School.
Ownership History
Date
Name
Owned For
Owner Type
Purchase Details
Closed on
Nov 9, 2007
Sold by
Lahouti Mahmoud Mitch
Bought by
Lahouti Mahmoud Mitch
Current Estimated Value
Purchase Details
Closed on
Aug 25, 2005
Sold by
Lahouti Mahmoud Mitch and Nakamura Debra Y
Bought by
Lahouti Mahmoud Mitch
Purchase Details
Closed on
Mar 14, 2002
Sold by
Usher Philip A
Bought by
Lahouti Mahmoud Mitch and Nakamura Debra Y
Home Financials for this Owner
Home Financials are based on the most recent Mortgage that was taken out on this home.
Original Mortgage
$240,000
Interest Rate
6.29%
Purchase Details
Closed on
Jun 17, 1998
Sold by
Greystone Homes Inc
Bought by
Usher Philip A
Home Financials for this Owner
Home Financials are based on the most recent Mortgage that was taken out on this home.
Original Mortgage
$300,000
Interest Rate
7.11%
Purchase Details
Closed on
Mar 17, 1998
Sold by
Usher Cynthia
Bought by
Usher Philip A
Create a Home Valuation Report for This Property
The Home Valuation Report is an in-depth analysis detailing your home's value as well as a comparison with similar homes in the area
Home Values in the Area
Average Home Value in this Area
Purchase History
| Date | Buyer | Sale Price | Title Company |
|---|---|---|---|
| Lahouti Mahmoud Mitch | -- | Accommodation | |
| Lahouti Mahmoud Mitch | -- | -- | |
| Lahouti Mahmoud Mitch | $440,000 | First Southwestern Title Co | |
| Usher Philip A | $317,500 | Lawyers Title | |
| Usher Philip A | -- | Lawyers Title |
Source: Public Records
Mortgage History
| Date | Status | Borrower | Loan Amount |
|---|---|---|---|
| Closed | Lahouti Mahmoud Mitch | $240,000 | |
| Previous Owner | Usher Philip A | $300,000 |
Source: Public Records
Tax History Compared to Growth
Tax History
| Year | Tax Paid | Tax Assessment Tax Assessment Total Assessment is a certain percentage of the fair market value that is determined by local assessors to be the total taxable value of land and additions on the property. | Land | Improvement |
|---|---|---|---|---|
| 2025 | $8,609 | $711,897 | $259,991 | $451,906 |
| 2024 | $8,609 | $697,939 | $254,893 | $443,046 |
| 2023 | $8,110 | $684,254 | $249,895 | $434,359 |
| 2022 | $8,096 | $670,838 | $244,995 | $425,843 |
| 2021 | $8,055 | $657,685 | $240,191 | $417,494 |
| 2020 | $7,278 | $594,329 | $237,729 | $356,600 |
| 2019 | $6,958 | $582,676 | $233,068 | $349,608 |
| 2018 | $6,909 | $571,252 | $228,499 | $342,753 |
| 2017 | $6,766 | $560,052 | $224,019 | $336,033 |
| 2016 | $6,474 | $549,072 | $219,627 | $329,445 |
| 2015 | $6,348 | $540,827 | $216,329 | $324,498 |
| 2014 | $6,269 | $530,236 | $212,093 | $318,143 |
Source: Public Records
Map
Nearby Homes
- 1912 Autumnbreeze Place
- 76 Robbins Ct
- 195 Tierra Rejada Rd Unit 190
- 195 Tierra Rejada Rd Unit 178
- 195 Tierra Rejada Rd Unit 160
- 195 Tierra Rejada Rd Unit 118
- 195 Tierra Rejada Rd Unit 1
- 195 Tierra Rejada Rd Unit 20
- 195 Tierra Rejada Rd Unit 52
- 195 Tierra Rejada Rd Unit 180
- 42 Skyflower Ln Unit 249
- 101 Red Brick Dr Unit 5
- 114 Red Brick Dr Unit 1
- 118 Red Brick Dr Unit 1
- 1675 Tanglebush Ln
- 230 Farmhouse Dr Unit 3
- 233 E Bonita Dr
- 1100 N Country Club Dr
- 1868 Autumn Place
- 1880 Autumn Place
- 1860 Autumn Place
- 1867 Summertime Ave
- 1886 Autumn Place
- 1863 Summertime Ave
- 1871 Summertime Ave
- 1859 Summertime Ave
- 1875 Summertime Ave
- 1871 Autumn Place
- 1858 Autumn Place
- 1879 Autumn Place
- 1865 Autumn Place
- 1890 Autumn Place
- 1855 Summertime Ave
- 1859 Autumn Place
- 1879 Summertime Ave
- 1854 Autumn Place
- 1857 Autumn Place
- 1889 Autumn Place