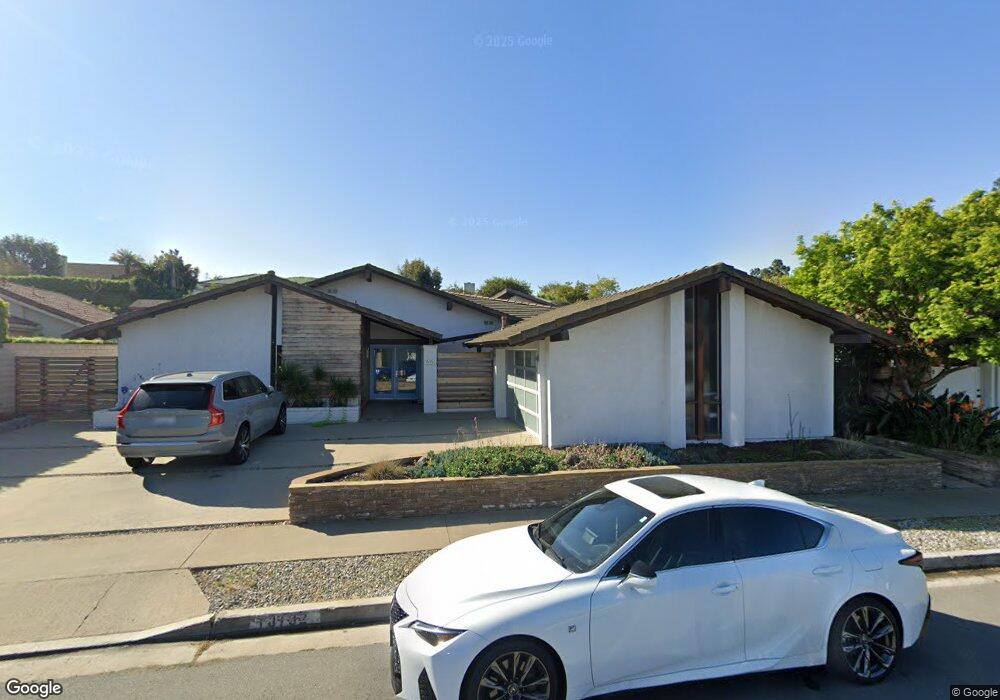
18762 Via Verona Irvine, CA 92603
Turtle Rock NeighborhoodEstimated Value: $2,728,000 - $4,023,000
3
Beds
2
Baths
3,370
Sq Ft
$1,005/Sq Ft
Est. Value
About This Home
This home is located at 18762 Via Verona, Irvine, CA 92603 and is currently estimated at $3,386,924, approximately $1,005 per square foot. 18762 Via Verona is a home located in Orange County with nearby schools including Turtle Rock Elementary, Rancho San Joaquin Middle School, and University High School.
Ownership History
Date
Name
Owned For
Owner Type
Purchase Details
Closed on
Dec 27, 2010
Sold by
Brown Teresa
Bought by
Clairicia Richard R and Clairicia Lauren Y
Current Estimated Value
Home Financials for this Owner
Home Financials are based on the most recent Mortgage that was taken out on this home.
Original Mortgage
$708,000
Outstanding Balance
$482,922
Interest Rate
4.79%
Mortgage Type
New Conventional
Estimated Equity
$2,904,002
Purchase Details
Closed on
Nov 17, 1997
Sold by
The Irvine Company
Bought by
Brown Donald J and Brown Teresa
Home Financials for this Owner
Home Financials are based on the most recent Mortgage that was taken out on this home.
Original Mortgage
$185,000
Interest Rate
7.22%
Purchase Details
Closed on
Oct 19, 1993
Sold by
Brown Donald J and Brown Teresa
Bought by
Brown Donald J and Brown Teresa
Home Financials for this Owner
Home Financials are based on the most recent Mortgage that was taken out on this home.
Original Mortgage
$90,000
Interest Rate
6.99%
Create a Home Valuation Report for This Property
The Home Valuation Report is an in-depth analysis detailing your home's value as well as a comparison with similar homes in the area
Home Values in the Area
Average Home Value in this Area
Purchase History
| Date | Buyer | Sale Price | Title Company |
|---|---|---|---|
| Clairicia Richard R | $885,000 | Fidelity National Title | |
| Brown Donald J | $89,000 | -- | |
| Brown Donald J | -- | United Title Company | |
| Brown Donald J | -- | United Title Company |
Source: Public Records
Mortgage History
| Date | Status | Borrower | Loan Amount |
|---|---|---|---|
| Open | Clairicia Richard R | $708,000 | |
| Previous Owner | Brown Donald J | $185,000 | |
| Previous Owner | Brown Donald J | $90,000 |
Source: Public Records
Tax History Compared to Growth
Tax History
| Year | Tax Paid | Tax Assessment Tax Assessment Total Assessment is a certain percentage of the fair market value that is determined by local assessors to be the total taxable value of land and additions on the property. | Land | Improvement |
|---|---|---|---|---|
| 2025 | $14,414 | $1,413,941 | $958,341 | $455,600 |
| 2024 | $14,414 | $1,386,217 | $939,550 | $446,667 |
| 2023 | $14,042 | $1,359,037 | $921,128 | $437,909 |
| 2022 | $13,790 | $1,332,390 | $903,067 | $429,323 |
| 2021 | $13,482 | $1,306,265 | $885,360 | $420,905 |
| 2020 | $13,405 | $1,292,871 | $876,281 | $416,590 |
| 2019 | $13,107 | $1,267,521 | $859,099 | $408,422 |
| 2018 | $12,878 | $1,242,668 | $842,254 | $400,414 |
| 2017 | $12,612 | $1,218,302 | $825,739 | $392,563 |
| 2016 | $11,330 | $1,123,428 | $809,548 | $313,880 |
| 2015 | $9,575 | $943,414 | $797,387 | $146,027 |
| 2014 | $9,388 | $924,934 | $781,767 | $143,167 |
Source: Public Records
Map
Nearby Homes
- 18816 Saginaw Dr
- 18802 Saginaw Dr
- 4886 Paseo de Vega
- 19112 Biddle Dr
- 17 Wandering Rill
- 15 Rocky Knoll
- 21 Centaurus
- 19165 Beckwith Terrace
- 19 Rippling Stream
- 53 Oxford Unit 14
- 53 Wellesley Unit 50
- 16 Wellesley Unit 2
- 17 Oxford Unit 28
- 111 Hillcrest
- 3 Longbourn Aisle
- 28 Exeter Unit 19
- 21 Rustling Wind
- 7 Altair
- 17 Brigadier
- 10 Lassen
- 18772 Via Verona
- 18752 Via Verona
- 18775 Via San Marco
- 18791 Via San Marco
- 18801 Via San Marco
- 18742 Via Verona
- 18792 Via Verona
- 18761 Via Verona
- 18771 Via Verona
- 18751 Via San Marco
- 18745 Via Verona
- 18821 Via San Marco
- 18732 Via Verona
- 18791 Via Verona
- 18741 Via San Marco
- 18731 Via Verona
- 18752 Via Siena
- 18782 Via San Marco
- 18762 Via San Marco
- 18792 Via San Marco