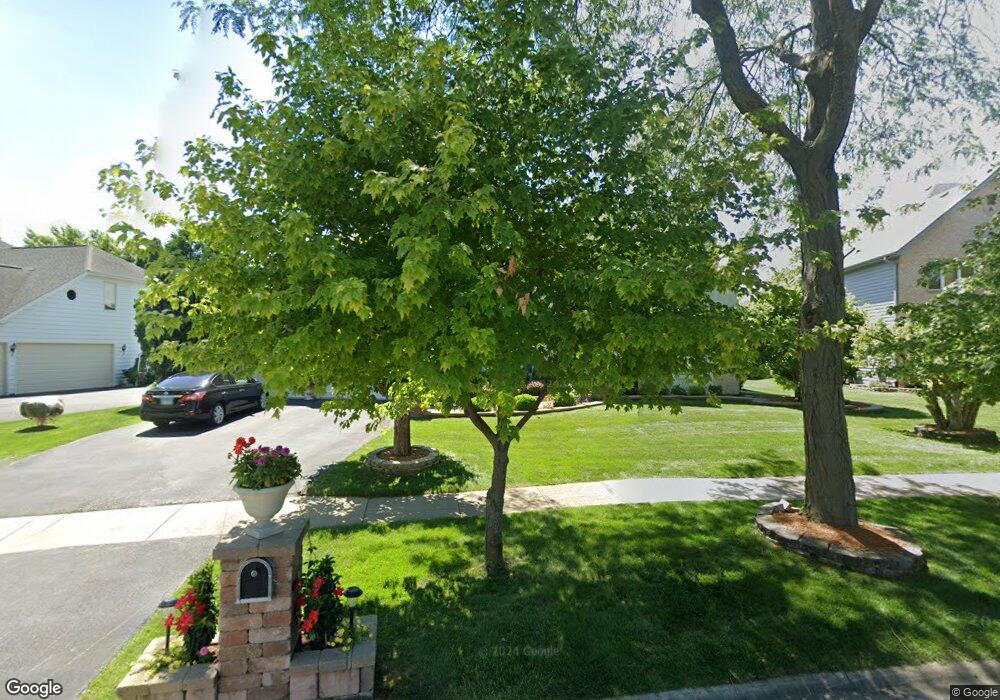
1877 Morgan Cir Naperville, IL 60565
Greene Valley NeighborhoodEstimated Value: $894,000 - $996,000
--
Bed
1
Bath
3,841
Sq Ft
$244/Sq Ft
Est. Value
About This Home
This home is located at 1877 Morgan Cir, Naperville, IL 60565 and is currently estimated at $937,526, approximately $244 per square foot. 1877 Morgan Cir is a home located in DuPage County with nearby schools including Ranch View Elementary School, Kennedy Junior High School, and Naperville Central High School.
Ownership History
Date
Name
Owned For
Owner Type
Purchase Details
Closed on
May 17, 2010
Sold by
Hamedani Fathollah and Fallahzadeh Vida
Bought by
Fallahzadeh Vida and Vida Fallahzadeh Trust
Current Estimated Value
Purchase Details
Closed on
May 24, 1996
Sold by
Udoni Michael
Bought by
Hamedani Fathollah and Fallahzadeh Vida
Home Financials for this Owner
Home Financials are based on the most recent Mortgage that was taken out on this home.
Original Mortgage
$328,400
Outstanding Balance
$16,208
Interest Rate
6.5%
Estimated Equity
$921,318
Purchase Details
Closed on
Sep 16, 1994
Sold by
Harris Bank Naperville
Bought by
Udoni Michael
Home Financials for this Owner
Home Financials are based on the most recent Mortgage that was taken out on this home.
Original Mortgage
$276,550
Interest Rate
6.62%
Create a Home Valuation Report for This Property
The Home Valuation Report is an in-depth analysis detailing your home's value as well as a comparison with similar homes in the area
Home Values in the Area
Average Home Value in this Area
Purchase History
| Date | Buyer | Sale Price | Title Company |
|---|---|---|---|
| Fallahzadeh Vida | -- | None Available | |
| Hamedani Fathollah | $410,500 | -- | |
| Udoni Michael | $346,000 | First American Title Insuran |
Source: Public Records
Mortgage History
| Date | Status | Borrower | Loan Amount |
|---|---|---|---|
| Open | Hamedani Fathollah | $328,400 | |
| Previous Owner | Udoni Michael | $276,550 |
Source: Public Records
Tax History Compared to Growth
Tax History
| Year | Tax Paid | Tax Assessment Tax Assessment Total Assessment is a certain percentage of the fair market value that is determined by local assessors to be the total taxable value of land and additions on the property. | Land | Improvement |
|---|---|---|---|---|
| 2024 | $14,187 | $239,575 | $69,906 | $169,669 |
| 2023 | $13,688 | $218,650 | $63,800 | $154,850 |
| 2022 | $12,859 | $204,690 | $59,730 | $144,960 |
| 2021 | $12,395 | $196,950 | $57,470 | $139,480 |
| 2020 | $12,133 | $193,410 | $56,440 | $136,970 |
| 2019 | $11,785 | $185,050 | $54,000 | $131,050 |
| 2018 | $12,430 | $194,790 | $56,840 | $137,950 |
| 2017 | $12,185 | $188,220 | $54,920 | $133,300 |
| 2016 | $11,948 | $181,410 | $52,930 | $128,480 |
| 2015 | $12,643 | $181,390 | $52,920 | $128,470 |
| 2014 | $13,055 | $181,390 | $52,920 | $128,470 |
| 2013 | $12,858 | $181,830 | $53,050 | $128,780 |
Source: Public Records
Map
Nearby Homes
- 1817 Appaloosa Dr
- 1704 Kenyon Dr
- 1519 77th St
- 1501 Clarkson Ct
- 1340 Auburn Ave
- 1323 Auburn Ave
- 23W731 Hobson Rd
- 23W711 Hobson Rd
- 1216 Tranquility Ct
- 7S610 Lynn Dr
- 2248 Aster Ct
- 523 Orleans Ave
- 1449 Whitespire Ct Unit 5104
- 1006 Bankfield Ct
- 816 Spindletree Ave
- 621 Bourbon Ct
- 6812 Greene Rd
- 8S452 Bell Dr
- 2230 Keim Rd Unit 3B
- 517 Sheffield Rd
- 1873 Morgan Cir
- 1891 Morgan Cir
- 1887 Appaloosa Dr
- 1887 Appaloosa Dr Unit 1
- 1885 Appaloosa Dr
- 1889 Appaloosa Dr
- 1883 Appaloosa Dr
- 1891 Appaloosa Dr
- 1869 Morgan Cir
- 1893 Appaloosa Dr
- 1879 Appaloosa Dr
- 1876 Morgan Cir
- 1895 Appaloosa Dr
- 1877 Appaloosa Dr
- 1895 Morgan Cir
- 1872 Morgan Cir
- 1897 Appaloosa Dr
- 1875 Appaloosa Dr
- 1865 Morgan Cir
- 1852 Shetland Rd