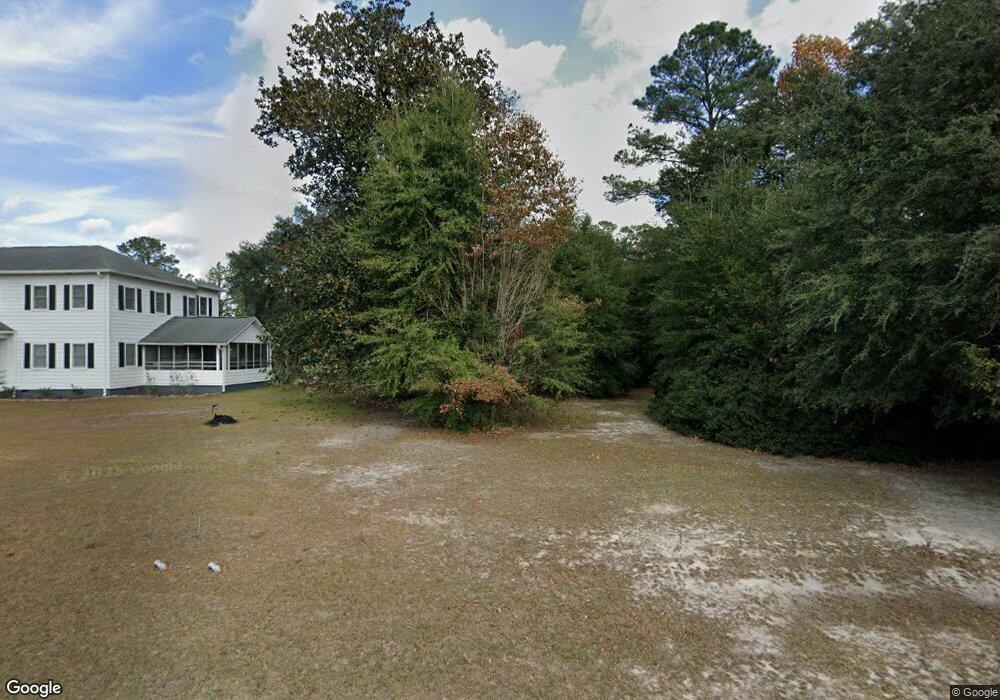
1878 Ga Highway 17 N Guyton, GA 31312
Estimated Value: $369,000 - $590,000
--
Bed
1
Bath
2,900
Sq Ft
$165/Sq Ft
Est. Value
About This Home
This home is located at 1878 Ga Highway 17 N, Guyton, GA 31312 and is currently estimated at $479,318, approximately $165 per square foot. 1878 Ga Highway 17 N is a home located in Effingham County with nearby schools including Guyton Elementary School, Effingham County Middle School, and Effingham County High School.
Ownership History
Date
Name
Owned For
Owner Type
Purchase Details
Closed on
Jun 1, 2018
Sold by
Mcgowan Nellie P
Bought by
Richards Phillip and Richards Pamela L
Current Estimated Value
Home Financials for this Owner
Home Financials are based on the most recent Mortgage that was taken out on this home.
Original Mortgage
$189,905
Outstanding Balance
$164,236
Interest Rate
4.5%
Mortgage Type
New Conventional
Estimated Equity
$315,082
Purchase Details
Closed on
Nov 27, 2017
Sold by
Mcgowan John Ross
Bought by
Mcgowan John Ross and Mcgowan Alaina Lynn
Purchase Details
Closed on
Aug 18, 2017
Sold by
Mcgowan Nellie P
Bought by
Mcgowan John Ross
Purchase Details
Closed on
Jun 7, 2014
Sold by
Mcgowan David
Bought by
Mcgowan Nellie P
Purchase Details
Closed on
Aug 5, 2011
Sold by
Mcgowan David
Bought by
Mcgowan John Ross
Purchase Details
Closed on
Mar 5, 1992
Bought by
Mcgowan David
Create a Home Valuation Report for This Property
The Home Valuation Report is an in-depth analysis detailing your home's value as well as a comparison with similar homes in the area
Home Values in the Area
Average Home Value in this Area
Purchase History
| Date | Buyer | Sale Price | Title Company |
|---|---|---|---|
| Richards Phillip | $199,900 | -- | |
| Mcgowan John Ross | -- | -- | |
| Mcgowan John Ross | -- | -- | |
| Mcgowan Nellie P | -- | -- | |
| Mcgowan John Ross | -- | -- | |
| Mcgowan David | -- | -- |
Source: Public Records
Mortgage History
| Date | Status | Borrower | Loan Amount |
|---|---|---|---|
| Open | Richards Phillip | $189,905 |
Source: Public Records
Tax History Compared to Growth
Tax History
| Year | Tax Paid | Tax Assessment Tax Assessment Total Assessment is a certain percentage of the fair market value that is determined by local assessors to be the total taxable value of land and additions on the property. | Land | Improvement |
|---|---|---|---|---|
| 2024 | $1,984 | $119,934 | $46,940 | $72,994 |
| 2023 | $1,354 | $116,554 | $46,940 | $69,615 |
| 2022 | $1,773 | $88,668 | $19,053 | $69,615 |
| 2021 | $1,722 | $86,174 | $18,320 | $67,854 |
| 2020 | $1,683 | $71,147 | $17,961 | $53,186 |
| 2019 | $2,259 | $69,688 | $16,502 | $53,186 |
| 2018 | $1,488 | $50,595 | $16,207 | $34,388 |
| 2017 | $1,516 | $51,523 | $16,581 | $34,942 |
| 2016 | $1,520 | $51,666 | $16,581 | $35,085 |
| 2015 | -- | $51,666 | $16,581 | $35,085 |
| 2014 | -- | $51,666 | $16,581 | $35,085 |
| 2013 | -- | $49,261 | $16,581 | $32,680 |
Source: Public Records
Map
Nearby Homes
- 112 Wakefield Dr
- 114 Wakefield Dr
- 1650 Georgia 17
- 104 Sunrise Dr
- 1650 Ga Highway 17 N
- 60 Del A Rae Cir
- 0 Del - A - Rae Cir Unit 10573783
- 5 Honeysuckle Ct
- 410 Newton Rd
- 106 Sumter St
- 106 Serenoa Dr
- 104 Juniper Dr
- 115 Juniper Dr
- 101 Juniper Dr
- 104 Serenoa Dr
- 311 Samuel Smalls Sr Ave
- 102 Taylor Ct
- 33 Blackberry Cir
- 1878 Highway 17 N
- 1878 Ga Highway 17 N
- 1900 Ga Highway 17 N
- 1849 Ga Highway 17 N
- 1895 Ga Highway 17 N
- 1895 Hwy 17 Hwy N
- 1895 Georgia 17
- 1836 Ga Highway 17 N
- 1946 Ga Highway 17 N
- 1799 Ga Highway 17 N
- 1980 Ga Highway 17 N
- 103 Wakefield Dr
- 101 Wakefield Dr
- 1915 Ga Highway 17 N
- 1758 Georgia 17
- 105 Wakefield Dr
- 0 Wakefield Dr
- 1758 Ga Highway 17 N
- 104 Wakefield Dr
- 104 Wakefield Dr Unit 3